Choctaw vs Australian Median Earnings

COMPARE

Choctaw
Race
Ancestry
AfghanAfricanAlaska NativeAlaskan AthabascanAlbanianAleutAlsatianAmericanApacheArabArapahoArgentineanArmenianAssyrian/Chaldean/SyriacAustrianBahamianBangladeshiBarbadianBasqueBelgianBelizeanBermudanBhutaneseBlackfeetBolivianBrazilianBritishBritish West IndianBulgarianBurmeseCajunCambodianCanadianCape VerdeanCarpatho RusynCelticCentral AmericanCentral American IndianCherokeeCheyenneChickasawChileanChineseChippewaChoctawColombianColvilleComancheCosta RicanCreeCreekCroatianCrowCubanCypriotCzechCzechoslovakianDanishDelawareDominicanDutchDutch West IndianEastern EuropeanEcuadorianEgyptianEnglishEstonianEthiopianEuropeanFijianFilipinoFinnishFrenchFrench American IndianFrench CanadianGermanGerman RussianGhanaianGreekGuamanian/ChamorroGuatemalanGuyaneseHaitianHmongHonduranHopiHoumaHungarianIcelanderIndian (Asian)IndonesianInupiatIranianIraqiIrishIroquoisIsraeliItalianJamaicanJapaneseJordanianKenyanKiowaKoreanLaotianLatvianLebaneseLiberianLithuanianLumbeeLuxembourgerMacedonianMalaysianMalteseMarshalleseMenomineeMexicanMexican American IndianMongolianMoroccanNative HawaiianNavajoNepaleseNew ZealanderNicaraguanNigerianNorthern EuropeanNorwegianOkinawanOsageOttawaPaiutePakistaniPalestinianPanamanianParaguayanPennsylvania GermanPeruvianPimaPolishPortuguesePotawatomiPuebloPuerto RicanPuget Sound SalishRomanianRussianSalvadoranSamoanScandinavianScotch-IrishScottishSeminoleSenegaleseSerbianShoshoneSierra LeoneanSiouxSlavicSlovakSloveneSomaliSouth AfricanSouth AmericanSouth American IndianSoviet UnionSpaniardSpanishSpanish AmericanSpanish American IndianSri LankanSubsaharan AfricanSudaneseSwedishSwissSyrianTaiwaneseThaiTlingit-HaidaTohono O'OdhamTonganTrinidadian and TobagonianTsimshianTurkishU.S. Virgin IslanderUgandanUkrainianUruguayanUteVenezuelanVietnameseWelshWest IndianYakamaYaquiYugoslavianYumanYup'ikZimbabwean
Immigration
NonimmigrantsImmigrantsAfghanistanAfricaAlbaniaArgentinaArmeniaAsiaAustraliaAustriaBahamasBangladeshBarbadosBelarusBelgiumBelizeBoliviaBosnia and HerzegovinaBrazilBulgariaBurma/MyanmarCabo VerdeCambodiaCameroonCanadaCaribbeanCentral AmericaChileChinaColombiaCongoCosta RicaCroatiaCubaCzechoslovakiaDenmarkDominicaDominican RepublicEastern AfricaEastern AsiaEastern EuropeEcuadorEgyptEl SalvadorEnglandEritreaEthiopiaEuropeFijiFranceGermanyGhanaGreeceGrenadaGuatemalaGuyanaHaitiHondurasHong KongHungaryIndiaIndonesiaIranIraqIrelandIsraelItalyJamaicaJapanJordanKazakhstanKenyaKoreaKuwaitLaosLatin AmericaLatviaLebanonLiberiaLithuaniaMalaysiaMexicoMicronesiaMiddle AfricaMoldovaMoroccoNepalNetherlandsNicaraguaNigeriaNorth AmericaNorth MacedoniaNorthern AfricaNorthern EuropeNorwayOceaniaPakistanPanamaPeruPhilippinesPolandPortugalRomaniaRussiaSaudi ArabiaScotlandSenegalSerbiaSierra LeoneSingaporeSomaliaSouth AfricaSouth AmericaSouth Central AsiaSouth Eastern AsiaSouthern EuropeSpainSri LankaSt. Vincent and the GrenadinesSudanSwedenSwitzerlandSyriaTaiwanThailandTrinidad and TobagoTurkeyUgandaUkraineUruguayUzbekistanVenezuelaVietnamWest IndiesWestern AfricaWestern AsiaWestern EuropeYemenZaireZimbabweAzores
Australian
Race
Ancestry
AfghanAfricanAlaska NativeAlaskan AthabascanAlbanianAleutAlsatianAmericanApacheArabArapahoArgentineanArmenianAssyrian/Chaldean/SyriacAustralianAustrianBahamianBangladeshiBarbadianBasqueBelgianBelizeanBermudanBhutaneseBlackfeetBolivianBrazilianBritishBritish West IndianBulgarianBurmeseCajunCambodianCanadianCape VerdeanCarpatho RusynCelticCentral AmericanCentral American IndianCherokeeCheyenneChickasawChileanChineseChippewaColombianColvilleComancheCosta RicanCreeCreekCroatianCrowCubanCypriotCzechCzechoslovakianDanishDelawareDominicanDutchDutch West IndianEastern EuropeanEcuadorianEgyptianEnglishEstonianEthiopianEuropeanFijianFilipinoFinnishFrenchFrench American IndianFrench CanadianGermanGerman RussianGhanaianGreekGuamanian/ChamorroGuatemalanGuyaneseHaitianHmongHonduranHopiHoumaHungarianIcelanderIndian (Asian)IndonesianInupiatIranianIraqiIrishIroquoisIsraeliItalianJamaicanJapaneseJordanianKenyanKiowaKoreanLaotianLatvianLebaneseLiberianLithuanianLumbeeLuxembourgerMacedonianMalaysianMalteseMarshalleseMenomineeMexicanMexican American IndianMongolianMoroccanNative HawaiianNavajoNepaleseNew ZealanderNicaraguanNigerianNorthern EuropeanNorwegianOkinawanOsageOttawaPaiutePakistaniPalestinianPanamanianParaguayanPennsylvania GermanPeruvianPimaPolishPortuguesePotawatomiPuebloPuerto RicanPuget Sound SalishRomanianRussianSalvadoranSamoanScandinavianScotch-IrishScottishSeminoleSenegaleseSerbianShoshoneSierra LeoneanSiouxSlavicSlovakSloveneSomaliSouth AfricanSouth AmericanSouth American IndianSoviet UnionSpaniardSpanishSpanish AmericanSpanish American IndianSri LankanSubsaharan AfricanSudaneseSwedishSwissSyrianTaiwaneseThaiTlingit-HaidaTohono O'OdhamTonganTrinidadian and TobagonianTsimshianTurkishU.S. Virgin IslanderUgandanUkrainianUruguayanUteVenezuelanVietnameseWelshWest IndianYakamaYaquiYugoslavianYumanYup'ikZimbabwean
Immigration
NonimmigrantsImmigrantsAfghanistanAfricaAlbaniaArgentinaArmeniaAsiaAustraliaAustriaBahamasBangladeshBarbadosBelarusBelgiumBelizeBoliviaBosnia and HerzegovinaBrazilBulgariaBurma/MyanmarCabo VerdeCambodiaCameroonCanadaCaribbeanCentral AmericaChileChinaColombiaCongoCosta RicaCroatiaCubaCzechoslovakiaDenmarkDominicaDominican RepublicEastern AfricaEastern AsiaEastern EuropeEcuadorEgyptEl SalvadorEnglandEritreaEthiopiaEuropeFijiFranceGermanyGhanaGreeceGrenadaGuatemalaGuyanaHaitiHondurasHong KongHungaryIndiaIndonesiaIranIraqIrelandIsraelItalyJamaicaJapanJordanKazakhstanKenyaKoreaKuwaitLaosLatin AmericaLatviaLebanonLiberiaLithuaniaMalaysiaMexicoMicronesiaMiddle AfricaMoldovaMoroccoNepalNetherlandsNicaraguaNigeriaNorth AmericaNorth MacedoniaNorthern AfricaNorthern EuropeNorwayOceaniaPakistanPanamaPeruPhilippinesPolandPortugalRomaniaRussiaSaudi ArabiaScotlandSenegalSerbiaSierra LeoneSingaporeSomaliaSouth AfricaSouth AmericaSouth Central AsiaSouth Eastern AsiaSouthern EuropeSpainSri LankaSt. Vincent and the GrenadinesSudanSwedenSwitzerlandSyriaTaiwanThailandTrinidad and TobagoTurkeyUgandaUkraineUruguayUzbekistanVenezuelaVietnamWest IndiesWestern AfricaWestern AsiaWestern EuropeYemenZaireZimbabweAzores
Median Earnings
Income
Poverty
Unemployment
Labor Participation
Family Structure
Vehicle Availability
Education Level
Disability

Median Earnings Comparison

Choctaw

Australians

Tragic
Exceptional
$40,270
MEDIAN EARNINGS
0.0/ 100
METRIC RATING
313th/ 347
METRIC RANK
$52,294
MEDIAN EARNINGS
100.0/ 100
METRIC RATING
47th/ 347
METRIC RANK

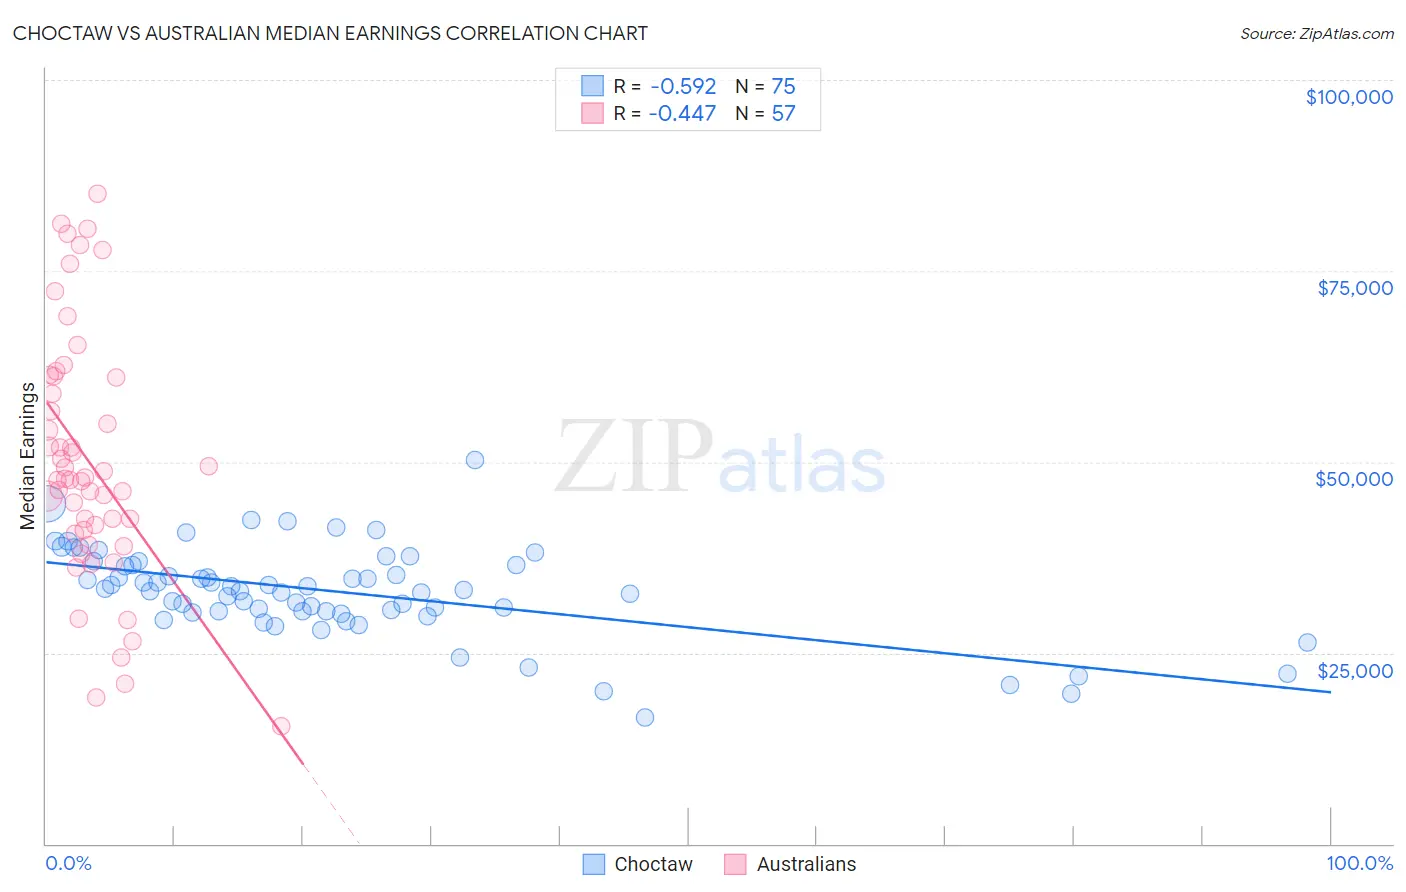
Choctaw vs Australian Median Earnings Correlation Chart

The statistical analysis conducted on geographies consisting of 269,709,236 people shows a substantial negative correlation between the proportion of Choctaw and median earnings in the United States with a correlation coefficient (R) of -0.592 and weighted average of $40,270. Similarly, the statistical analysis conducted on geographies consisting of 224,158,339 people shows a moderate negative correlation between the proportion of Australians and median earnings in the United States with a correlation coefficient (R) of -0.447 and weighted average of $52,294, a difference of 29.9%.
Choctaw vs Australian Median Earnings

Median Earnings Correlation Summary

MeasurementChoctawAustralian
Minimum$16,607$15,451
Maximum$50,240$85,069
Range$33,633$69,618
Mean$33,003$50,151
Median$33,256$47,849
Interquartile 25% (IQ1)$30,391$40,819
Interquartile 75% (IQ3)$36,563$61,206
Interquartile Range (IQR)$6,172$20,387
Standard Deviation (Sample)$5,920$16,224
Standard Deviation (Population)$5,880$16,081

Similar Demographics by Median Earnings

Demographics Similar to Choctaw by Median Earnings

In terms of median earnings, the demographic groups most similar to Choctaw are Hispanic or Latino ($40,288, a difference of 0.040%), Chippewa ($40,287, a difference of 0.040%), Cheyenne ($40,233, a difference of 0.090%), Seminole ($40,233, a difference of 0.090%), and Immigrants from Honduras ($40,195, a difference of 0.19%).
DemographicsRating | RankMedian Earnings
Yaqui
0.0
/100
|
#306
Tragic
$40,647
Hondurans
0.0
/100
|
#307
Tragic
$40,638
Cubans
0.0
/100
|
#308
Tragic
$40,619
Immigrants | Haiti
0.0
/100
|
#309
Tragic
$40,550
Apache
0.0
/100
|
#310
Tragic
$40,388
Hispanics or Latinos
0.0
/100
|
#311
Tragic
$40,288
Chippewa
0.0
/100
|
#312
Tragic
$40,287
Choctaw
0.0
/100
|
#313
Tragic
$40,270
Cheyenne
0.0
/100
|
#314
Tragic
$40,233
Seminole
0.0
/100
|
#315
Tragic
$40,233
Immigrants | Honduras
0.0
/100
|
#316
Tragic
$40,195
Fijians
0.0
/100
|
#317
Tragic
$40,193
Dutch West Indians
0.0
/100
|
#318
Tragic
$40,107
Blacks/African Americans
0.0
/100
|
#319
Tragic
$40,085
Immigrants | Bahamas
0.0
/100
|
#320
Tragic
$39,861

Demographics Similar to Australians by Median Earnings

In terms of median earnings, the demographic groups most similar to Australians are Bhutanese ($52,297, a difference of 0.010%), Immigrants from Czechoslovakia ($52,361, a difference of 0.13%), Immigrants from Europe ($52,195, a difference of 0.19%), Immigrants from Malaysia ($52,514, a difference of 0.42%), and Bulgarian ($52,512, a difference of 0.42%).
DemographicsRating | RankMedian Earnings
Israelis
100.0
/100
|
#40
Exceptional
$52,937
Immigrants | Lithuania
100.0
/100
|
#41
Exceptional
$52,769
Maltese
100.0
/100
|
#42
Exceptional
$52,526
Immigrants | Malaysia
100.0
/100
|
#43
Exceptional
$52,514
Bulgarians
100.0
/100
|
#44
Exceptional
$52,512
Immigrants | Czechoslovakia
100.0
/100
|
#45
Exceptional
$52,361
Bhutanese
100.0
/100
|
#46
Exceptional
$52,297
Australians
100.0
/100
|
#47
Exceptional
$52,294
Immigrants | Europe
100.0
/100
|
#48
Exceptional
$52,195
Bolivians
100.0
/100
|
#49
Exceptional
$52,005
Immigrants | South Africa
100.0
/100
|
#50
Exceptional
$51,850
Immigrants | Austria
99.9
/100
|
#51
Exceptional
$51,826
Estonians
99.9
/100
|
#52
Exceptional
$51,772
Immigrants | Norway
99.9
/100
|
#53
Exceptional
$51,758
Immigrants | Indonesia
99.9
/100
|
#54
Exceptional
$51,715