Chippewa vs Spanish American Householder Income Ages 25 - 44 years
COMPARE
Chippewa
Spanish American
Householder Income Ages 25 - 44 years
Householder Income Ages 25 - 44 years Comparison
Chippewa
Spanish Americans
$80,005
HOUSEHOLDER INCOME AGES 25 - 44 YEARS
0.0/ 100
METRIC RATING
309th/ 347
METRIC RANK
$83,722
HOUSEHOLDER INCOME AGES 25 - 44 YEARS
0.2/ 100
METRIC RATING
272nd/ 347
METRIC RANK
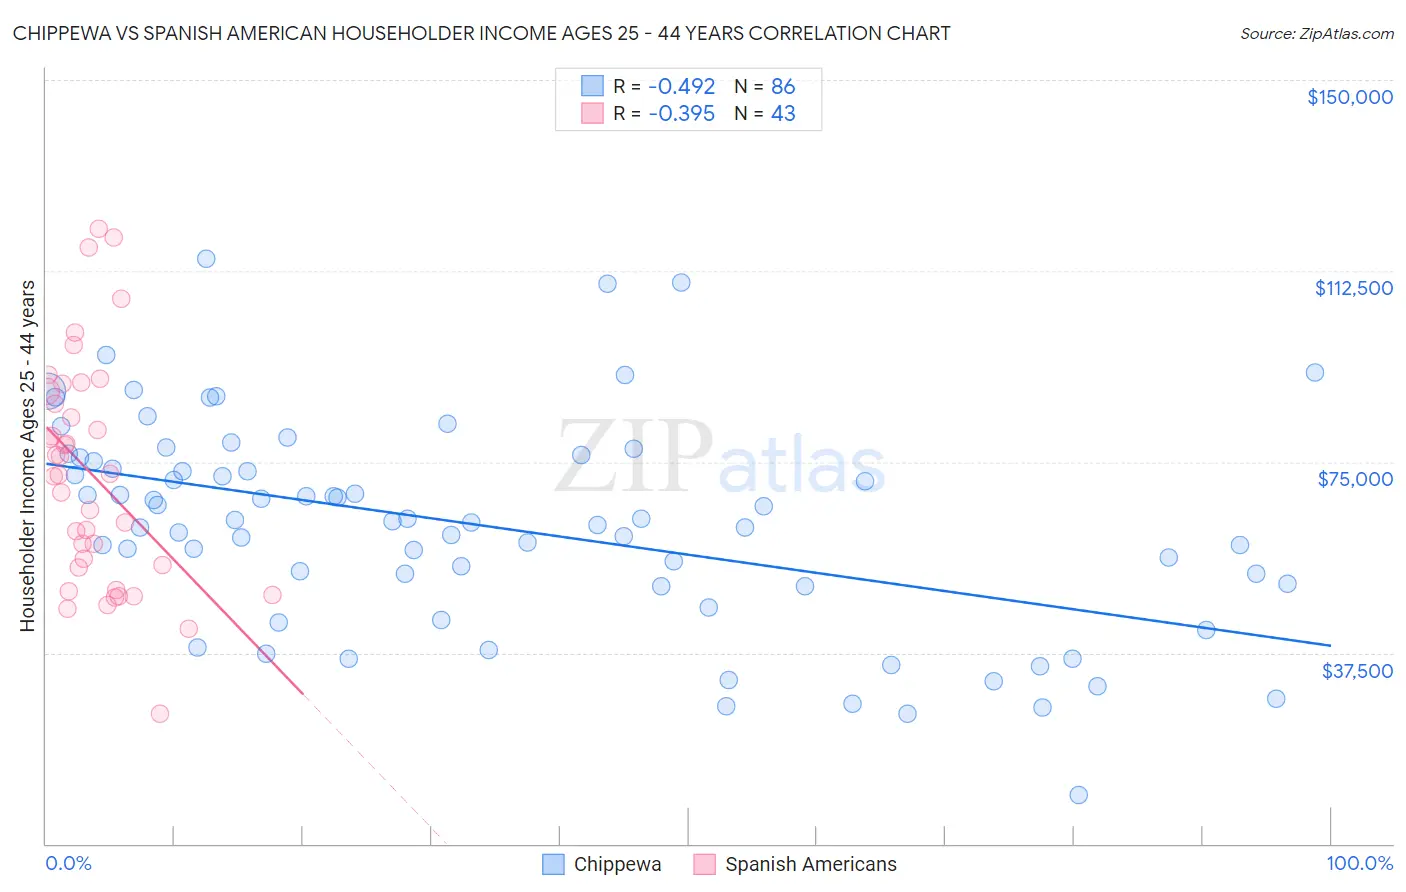
Chippewa vs Spanish American Householder Income Ages 25 - 44 years Correlation Chart
The statistical analysis conducted on geographies consisting of 214,656,590 people shows a moderate negative correlation between the proportion of Chippewa and household income with householder between the ages 25 and 44 in the United States with a correlation coefficient (R) of -0.492 and weighted average of $80,005. Similarly, the statistical analysis conducted on geographies consisting of 103,075,966 people shows a mild negative correlation between the proportion of Spanish Americans and household income with householder between the ages 25 and 44 in the United States with a correlation coefficient (R) of -0.395 and weighted average of $83,722, a difference of 4.6%.
Householder Income Ages 25 - 44 years Correlation Summary
| Measurement | Chippewa | Spanish American |
| Minimum | $9,500 | $25,625 |
| Maximum | $114,792 | $120,725 |
| Range | $105,292 | $95,100 |
| Mean | $62,281 | $72,343 |
| Median | $63,204 | $72,340 |
| Interquartile 25% (IQ1) | $50,634 | $54,252 |
| Interquartile 75% (IQ3) | $75,056 | $88,756 |
| Interquartile Range (IQR) | $24,422 | $34,503 |
| Standard Deviation (Sample) | $20,701 | $22,283 |
| Standard Deviation (Population) | $20,580 | $22,022 |
Similar Demographics by Householder Income Ages 25 - 44 years
Demographics Similar to Chippewa by Householder Income Ages 25 - 44 years
In terms of householder income ages 25 - 44 years, the demographic groups most similar to Chippewa are Immigrants from Central America ($80,012, a difference of 0.010%), Haitian ($80,055, a difference of 0.060%), Fijian ($79,956, a difference of 0.060%), Apache ($80,260, a difference of 0.32%), and Immigrants from Dominican Republic ($80,319, a difference of 0.39%).
| Demographics | Rating | Rank | Householder Income Ages 25 - 44 years |
| Hispanics or Latinos | 0.0 /100 | #302 | Tragic $80,515 |
| Mexicans | 0.0 /100 | #303 | Tragic $80,427 |
| Immigrants | Caribbean | 0.0 /100 | #304 | Tragic $80,326 |
| Immigrants | Dominican Republic | 0.0 /100 | #305 | Tragic $80,319 |
| Apache | 0.0 /100 | #306 | Tragic $80,260 |
| Haitians | 0.0 /100 | #307 | Tragic $80,055 |
| Immigrants | Central America | 0.0 /100 | #308 | Tragic $80,012 |
| Chippewa | 0.0 /100 | #309 | Tragic $80,005 |
| Fijians | 0.0 /100 | #310 | Tragic $79,956 |
| Indonesians | 0.0 /100 | #311 | Tragic $79,543 |
| Immigrants | Haiti | 0.0 /100 | #312 | Tragic $79,391 |
| Menominee | 0.0 /100 | #313 | Tragic $79,358 |
| Cheyenne | 0.0 /100 | #314 | Tragic $79,152 |
| Ottawa | 0.0 /100 | #315 | Tragic $79,012 |
| Africans | 0.0 /100 | #316 | Tragic $78,986 |
Demographics Similar to Spanish Americans by Householder Income Ages 25 - 44 years
In terms of householder income ages 25 - 44 years, the demographic groups most similar to Spanish Americans are Somali ($83,752, a difference of 0.040%), Iroquois ($83,682, a difference of 0.050%), Marshallese ($83,575, a difference of 0.18%), Jamaican ($83,933, a difference of 0.25%), and Spanish American Indian ($84,085, a difference of 0.43%).
| Demographics | Rating | Rank | Householder Income Ages 25 - 44 years |
| Sudanese | 0.4 /100 | #265 | Tragic $84,401 |
| Immigrants | Cabo Verde | 0.3 /100 | #266 | Tragic $84,304 |
| Hmong | 0.3 /100 | #267 | Tragic $84,258 |
| Sub-Saharan Africans | 0.3 /100 | #268 | Tragic $84,235 |
| Spanish American Indians | 0.3 /100 | #269 | Tragic $84,085 |
| Jamaicans | 0.3 /100 | #270 | Tragic $83,933 |
| Somalis | 0.2 /100 | #271 | Tragic $83,752 |
| Spanish Americans | 0.2 /100 | #272 | Tragic $83,722 |
| Iroquois | 0.2 /100 | #273 | Tragic $83,682 |
| Marshallese | 0.2 /100 | #274 | Tragic $83,575 |
| Immigrants | Jamaica | 0.2 /100 | #275 | Tragic $83,298 |
| Immigrants | Belize | 0.2 /100 | #276 | Tragic $83,141 |
| Paiute | 0.2 /100 | #277 | Tragic $82,984 |
| Senegalese | 0.2 /100 | #278 | Tragic $82,852 |
| Pima | 0.1 /100 | #279 | Tragic $82,821 |