Chinese vs Immigrants from Zaire Householder Income Under 25 years
COMPARE
Chinese
Immigrants from Zaire
Householder Income Under 25 years
Householder Income Under 25 years Comparison
Chinese
Immigrants from Zaire
$58,162
HOUSEHOLDER INCOME UNDER 25 YEARS
100.0/ 100
METRIC RATING
9th/ 347
METRIC RANK
$45,529
HOUSEHOLDER INCOME UNDER 25 YEARS
0.0/ 100
METRIC RATING
331st/ 347
METRIC RANK
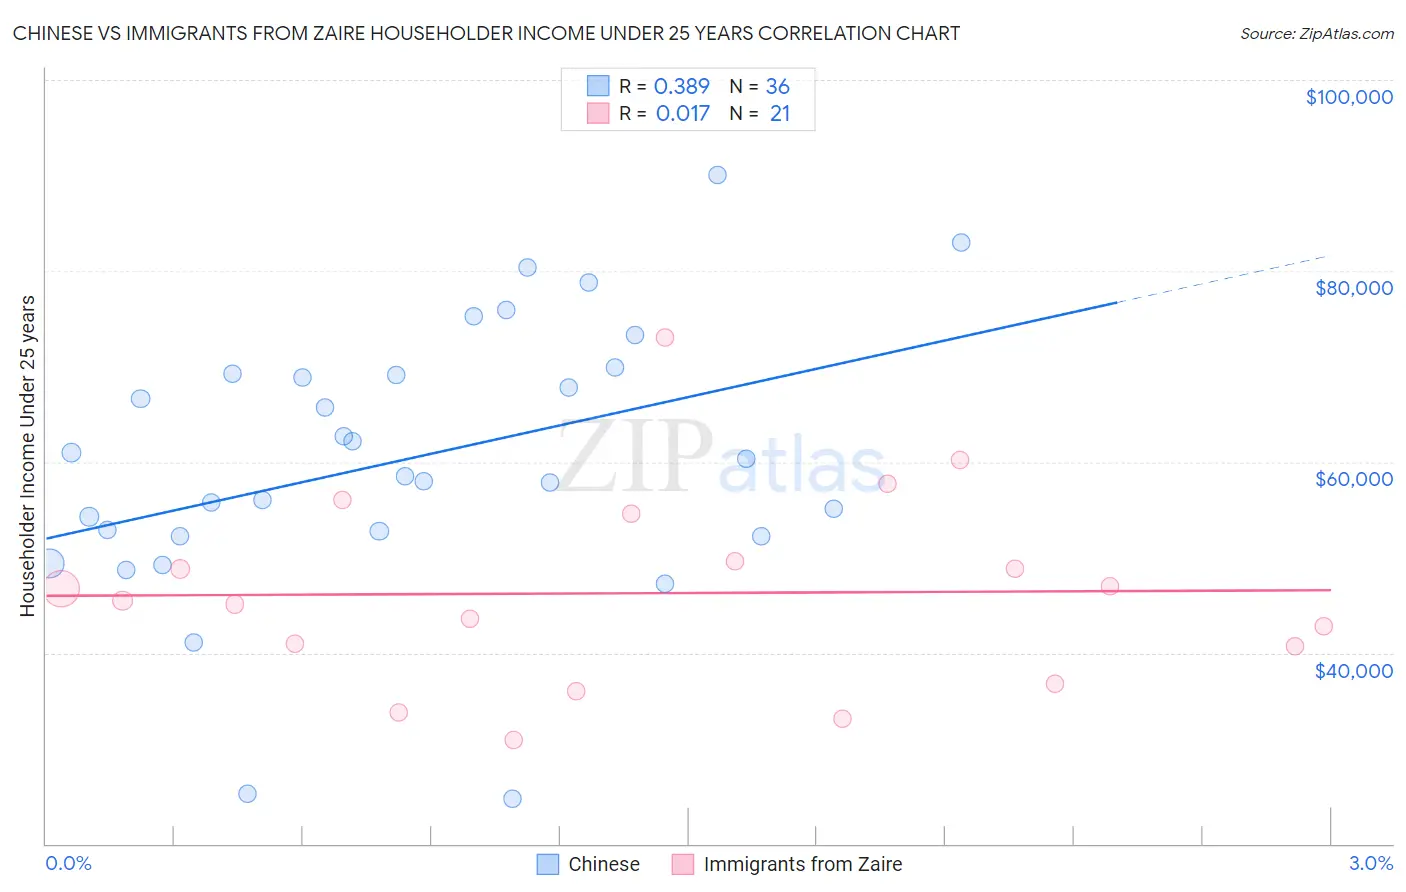
Chinese vs Immigrants from Zaire Householder Income Under 25 years Correlation Chart
The statistical analysis conducted on geographies consisting of 61,331,136 people shows a mild positive correlation between the proportion of Chinese and household income with householder under the age of 25 in the United States with a correlation coefficient (R) of 0.389 and weighted average of $58,162. Similarly, the statistical analysis conducted on geographies consisting of 101,704,026 people shows no correlation between the proportion of Immigrants from Zaire and household income with householder under the age of 25 in the United States with a correlation coefficient (R) of 0.017 and weighted average of $45,529, a difference of 27.8%.
Householder Income Under 25 years Correlation Summary
| Measurement | Chinese | Immigrants from Zaire |
| Minimum | $24,709 | $30,877 |
| Maximum | $90,052 | $73,045 |
| Range | $65,343 | $42,168 |
| Mean | $60,302 | $46,246 |
| Median | $59,375 | $45,465 |
| Interquartile 25% (IQ1) | $52,464 | $38,741 |
| Interquartile 75% (IQ3) | $69,171 | $52,065 |
| Interquartile Range (IQR) | $16,707 | $13,324 |
| Standard Deviation (Sample) | $14,147 | $10,181 |
| Standard Deviation (Population) | $13,949 | $9,936 |
Similar Demographics by Householder Income Under 25 years
Demographics Similar to Chinese by Householder Income Under 25 years
In terms of householder income under 25 years, the demographic groups most similar to Chinese are Indian (Asian) ($58,239, a difference of 0.13%), Afghan ($58,019, a difference of 0.25%), Immigrants from China ($57,931, a difference of 0.40%), Immigrants from Philippines ($57,930, a difference of 0.40%), and Bolivian ($58,506, a difference of 0.59%).
| Demographics | Rating | Rank | Householder Income Under 25 years |
| Immigrants | Hong Kong | 100.0 /100 | #2 | Exceptional $62,083 |
| Immigrants | India | 100.0 /100 | #3 | Exceptional $59,914 |
| Immigrants | Taiwan | 100.0 /100 | #4 | Exceptional $59,424 |
| Immigrants | Bolivia | 100.0 /100 | #5 | Exceptional $59,389 |
| Thais | 100.0 /100 | #6 | Exceptional $59,187 |
| Bolivians | 100.0 /100 | #7 | Exceptional $58,506 |
| Indians (Asian) | 100.0 /100 | #8 | Exceptional $58,239 |
| Chinese | 100.0 /100 | #9 | Exceptional $58,162 |
| Afghans | 100.0 /100 | #10 | Exceptional $58,019 |
| Immigrants | China | 100.0 /100 | #11 | Exceptional $57,931 |
| Immigrants | Philippines | 100.0 /100 | #12 | Exceptional $57,930 |
| Immigrants | South Central Asia | 100.0 /100 | #13 | Exceptional $57,818 |
| Filipinos | 100.0 /100 | #14 | Exceptional $57,740 |
| Koreans | 100.0 /100 | #15 | Exceptional $57,730 |
| Immigrants | Afghanistan | 100.0 /100 | #16 | Exceptional $57,478 |
Demographics Similar to Immigrants from Zaire by Householder Income Under 25 years
In terms of householder income under 25 years, the demographic groups most similar to Immigrants from Zaire are Indonesian ($45,566, a difference of 0.080%), Choctaw ($45,450, a difference of 0.17%), Seminole ($45,649, a difference of 0.26%), German Russian ($45,673, a difference of 0.32%), and Creek ($45,371, a difference of 0.35%).
| Demographics | Rating | Rank | Householder Income Under 25 years |
| Dutch West Indians | 0.0 /100 | #324 | Tragic $45,816 |
| Immigrants | Bahamas | 0.0 /100 | #325 | Tragic $45,793 |
| Osage | 0.0 /100 | #326 | Tragic $45,764 |
| Bahamians | 0.0 /100 | #327 | Tragic $45,743 |
| German Russians | 0.0 /100 | #328 | Tragic $45,673 |
| Seminole | 0.0 /100 | #329 | Tragic $45,649 |
| Indonesians | 0.0 /100 | #330 | Tragic $45,566 |
| Immigrants | Zaire | 0.0 /100 | #331 | Tragic $45,529 |
| Choctaw | 0.0 /100 | #332 | Tragic $45,450 |
| Creek | 0.0 /100 | #333 | Tragic $45,371 |
| Cajuns | 0.0 /100 | #334 | Tragic $45,338 |
| Cheyenne | 0.0 /100 | #335 | Tragic $45,275 |
| Tohono O'odham | 0.0 /100 | #336 | Tragic $45,248 |
| Pueblo | 0.0 /100 | #337 | Tragic $45,018 |
| Chickasaw | 0.0 /100 | #338 | Tragic $44,763 |