Chinese vs Immigrants from Asia Median Female Earnings
COMPARE
Chinese
Immigrants from Asia
Median Female Earnings
Median Female Earnings Comparison
Chinese
Immigrants from Asia
$41,461
MEDIAN FEMALE EARNINGS
97.5/ 100
METRIC RATING
109th/ 347
METRIC RANK
$44,198
MEDIAN FEMALE EARNINGS
100.0/ 100
METRIC RATING
33rd/ 347
METRIC RANK
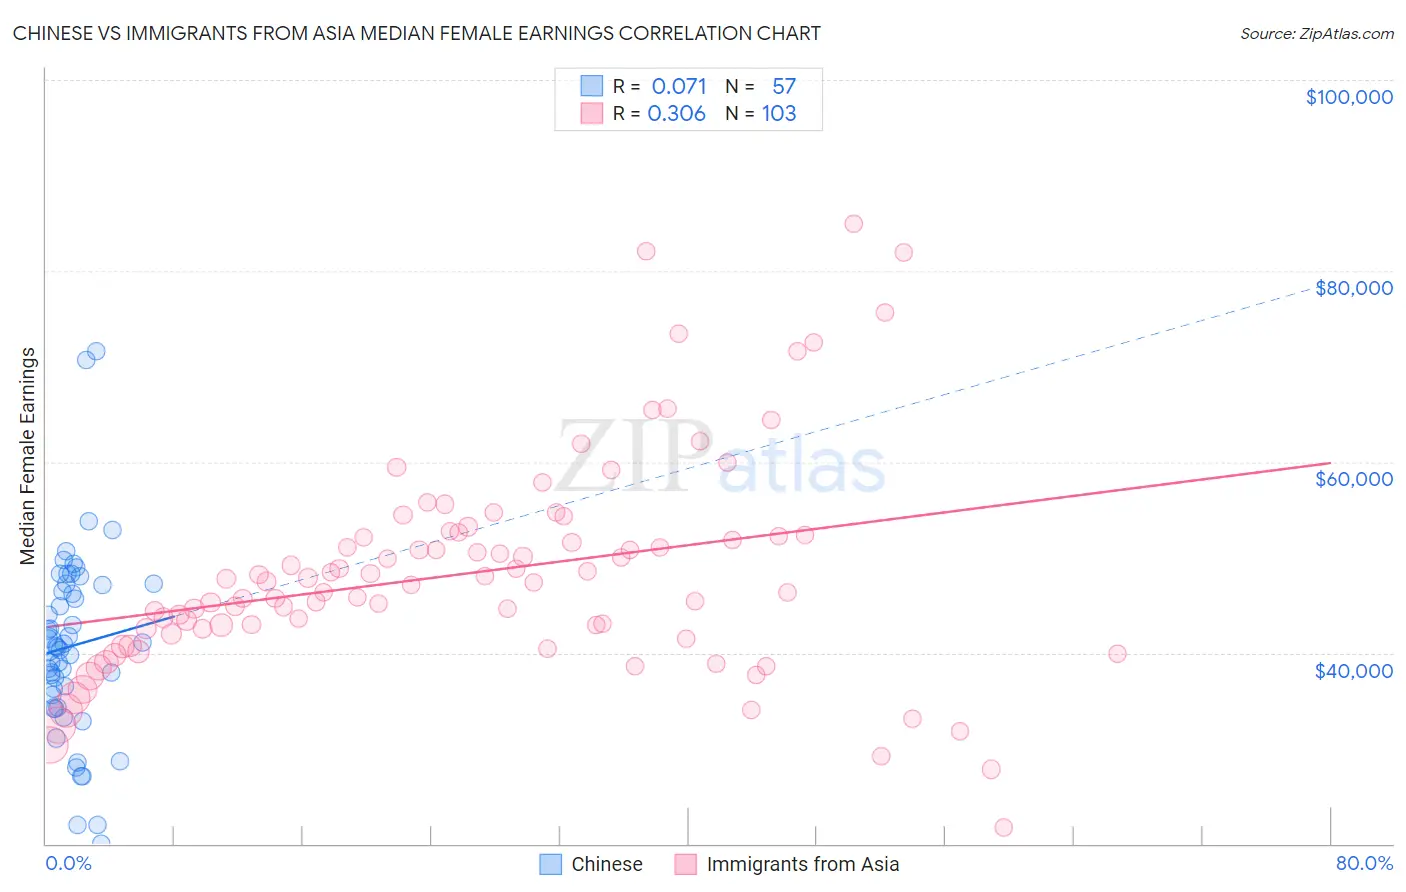
Chinese vs Immigrants from Asia Median Female Earnings Correlation Chart
The statistical analysis conducted on geographies consisting of 64,808,152 people shows a slight positive correlation between the proportion of Chinese and median female earnings in the United States with a correlation coefficient (R) of 0.071 and weighted average of $41,461. Similarly, the statistical analysis conducted on geographies consisting of 548,277,382 people shows a mild positive correlation between the proportion of Immigrants from Asia and median female earnings in the United States with a correlation coefficient (R) of 0.306 and weighted average of $44,198, a difference of 6.6%.
Median Female Earnings Correlation Summary
| Measurement | Chinese | Immigrants from Asia |
| Minimum | $20,043 | $21,667 |
| Maximum | $71,591 | $84,949 |
| Range | $51,548 | $63,282 |
| Mean | $40,727 | $48,373 |
| Median | $40,673 | $47,404 |
| Interquartile 25% (IQ1) | $34,915 | $41,959 |
| Interquartile 75% (IQ3) | $47,174 | $52,302 |
| Interquartile Range (IQR) | $12,258 | $10,343 |
| Standard Deviation (Sample) | $9,803 | $11,346 |
| Standard Deviation (Population) | $9,716 | $11,291 |
Similar Demographics by Median Female Earnings
Demographics Similar to Chinese by Median Female Earnings
In terms of median female earnings, the demographic groups most similar to Chinese are Jordanian ($41,464, a difference of 0.010%), Palestinian ($41,484, a difference of 0.050%), Immigrants from Eritrea ($41,485, a difference of 0.060%), Italian ($41,505, a difference of 0.10%), and Immigrants from Zimbabwe ($41,527, a difference of 0.16%).
| Demographics | Rating | Rank | Median Female Earnings |
| Immigrants | Poland | 98.2 /100 | #102 | Exceptional $41,630 |
| Immigrants | Argentina | 97.9 /100 | #103 | Exceptional $41,554 |
| Immigrants | Zimbabwe | 97.8 /100 | #104 | Exceptional $41,527 |
| Italians | 97.7 /100 | #105 | Exceptional $41,505 |
| Immigrants | Eritrea | 97.6 /100 | #106 | Exceptional $41,485 |
| Palestinians | 97.6 /100 | #107 | Exceptional $41,484 |
| Jordanians | 97.5 /100 | #108 | Exceptional $41,464 |
| Chinese | 97.5 /100 | #109 | Exceptional $41,461 |
| Immigrants | Western Asia | 97.0 /100 | #110 | Exceptional $41,375 |
| Immigrants | Canada | 97.0 /100 | #111 | Exceptional $41,373 |
| Immigrants | North America | 96.7 /100 | #112 | Exceptional $41,319 |
| Macedonians | 96.4 /100 | #113 | Exceptional $41,286 |
| Immigrants | England | 96.4 /100 | #114 | Exceptional $41,277 |
| Koreans | 96.4 /100 | #115 | Exceptional $41,276 |
| Immigrants | Brazil | 96.4 /100 | #116 | Exceptional $41,273 |
Demographics Similar to Immigrants from Asia by Median Female Earnings
In terms of median female earnings, the demographic groups most similar to Immigrants from Asia are Russian ($44,169, a difference of 0.070%), Immigrants from Sri Lanka ($44,161, a difference of 0.080%), Immigrants from Turkey ($44,066, a difference of 0.30%), Immigrants from Northern Europe ($44,366, a difference of 0.38%), and Immigrants from Switzerland ($43,996, a difference of 0.46%).
| Demographics | Rating | Rank | Median Female Earnings |
| Immigrants | Belarus | 100.0 /100 | #26 | Exceptional $44,757 |
| Turks | 100.0 /100 | #27 | Exceptional $44,695 |
| Immigrants | Russia | 100.0 /100 | #28 | Exceptional $44,680 |
| Immigrants | Belgium | 100.0 /100 | #29 | Exceptional $44,587 |
| Asians | 100.0 /100 | #30 | Exceptional $44,586 |
| Immigrants | France | 100.0 /100 | #31 | Exceptional $44,541 |
| Immigrants | Northern Europe | 100.0 /100 | #32 | Exceptional $44,366 |
| Immigrants | Asia | 100.0 /100 | #33 | Exceptional $44,198 |
| Russians | 100.0 /100 | #34 | Exceptional $44,169 |
| Immigrants | Sri Lanka | 100.0 /100 | #35 | Exceptional $44,161 |
| Immigrants | Turkey | 100.0 /100 | #36 | Exceptional $44,066 |
| Immigrants | Switzerland | 100.0 /100 | #37 | Exceptional $43,996 |
| Latvians | 100.0 /100 | #38 | Exceptional $43,941 |
| Israelis | 100.0 /100 | #39 | Exceptional $43,852 |
| Immigrants | Malaysia | 100.0 /100 | #40 | Exceptional $43,835 |