Chilean vs Irish Median Family Income
COMPARE
Chilean
Irish
Median Family Income
Median Family Income Comparison
Chileans
Irish
$108,429
MEDIAN FAMILY INCOME
95.0/ 100
METRIC RATING
116th/ 347
METRIC RANK
$105,453
MEDIAN FAMILY INCOME
80.5/ 100
METRIC RATING
150th/ 347
METRIC RANK
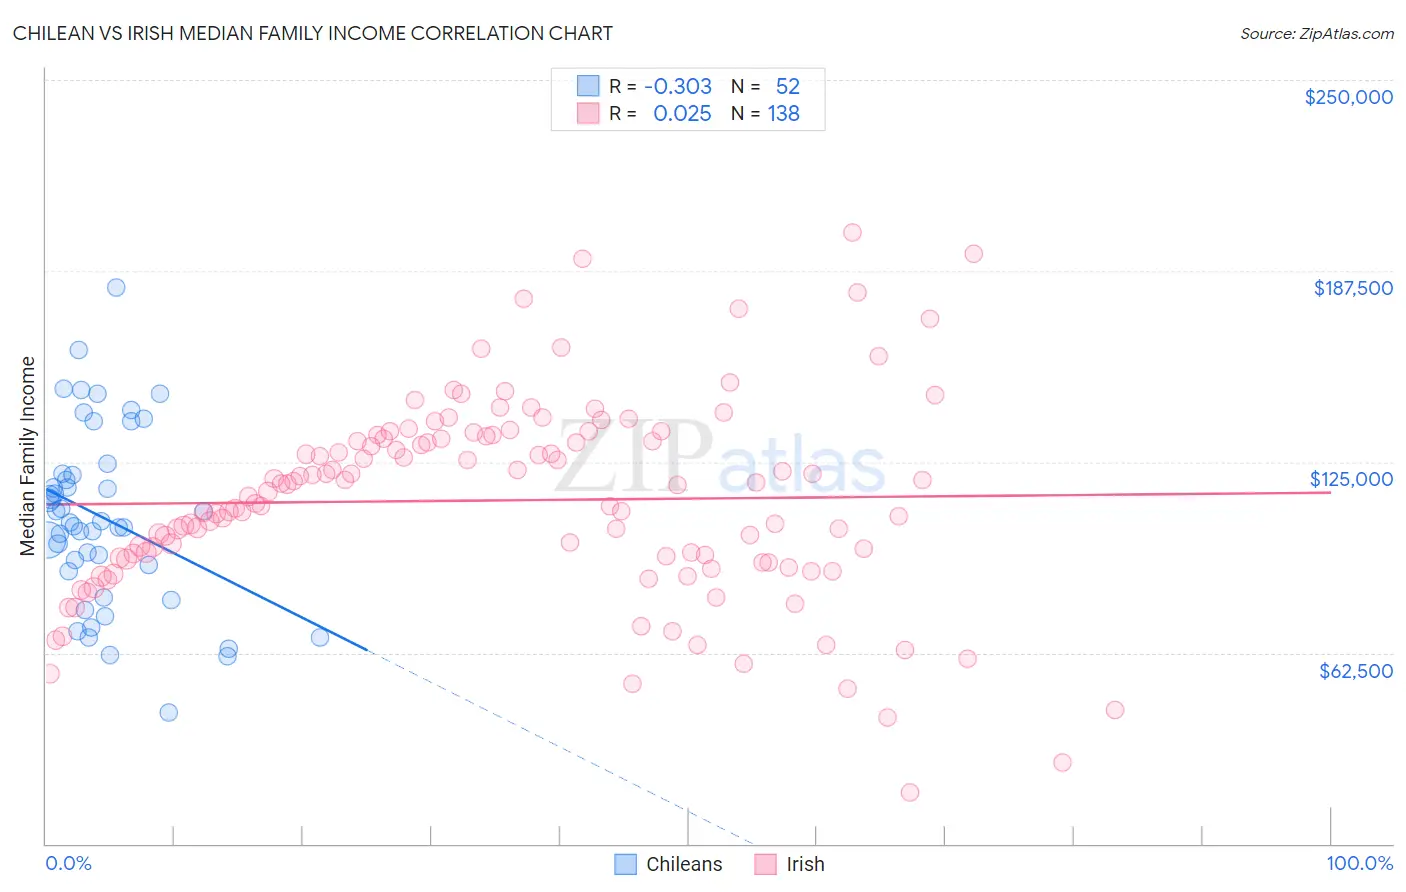
Chilean vs Irish Median Family Income Correlation Chart
The statistical analysis conducted on geographies consisting of 256,482,123 people shows a mild negative correlation between the proportion of Chileans and median family income in the United States with a correlation coefficient (R) of -0.303 and weighted average of $108,429. Similarly, the statistical analysis conducted on geographies consisting of 578,674,482 people shows no correlation between the proportion of Irish and median family income in the United States with a correlation coefficient (R) of 0.025 and weighted average of $105,453, a difference of 2.8%.
Median Family Income Correlation Summary
| Measurement | Chilean | Irish |
| Minimum | $42,833 | $16,721 |
| Maximum | $182,212 | $200,267 |
| Range | $139,379 | $183,546 |
| Mean | $106,873 | $112,390 |
| Median | $105,526 | $114,410 |
| Interquartile 25% (IQ1) | $90,247 | $93,102 |
| Interquartile 75% (IQ3) | $120,874 | $132,553 |
| Interquartile Range (IQR) | $30,627 | $39,451 |
| Standard Deviation (Sample) | $28,929 | $32,421 |
| Standard Deviation (Population) | $28,649 | $32,303 |
Similar Demographics by Median Family Income
Demographics Similar to Chileans by Median Family Income
In terms of median family income, the demographic groups most similar to Chileans are Swedish ($108,499, a difference of 0.060%), Polish ($108,507, a difference of 0.070%), Immigrants from Saudi Arabia ($108,544, a difference of 0.11%), Immigrants from Poland ($108,570, a difference of 0.13%), and Immigrants from Philippines ($108,288, a difference of 0.13%).
| Demographics | Rating | Rank | Median Family Income |
| Immigrants | Afghanistan | 95.6 /100 | #109 | Exceptional $108,709 |
| British | 95.6 /100 | #110 | Exceptional $108,705 |
| Immigrants | Western Asia | 95.6 /100 | #111 | Exceptional $108,691 |
| Immigrants | Poland | 95.3 /100 | #112 | Exceptional $108,570 |
| Immigrants | Saudi Arabia | 95.2 /100 | #113 | Exceptional $108,544 |
| Poles | 95.2 /100 | #114 | Exceptional $108,507 |
| Swedes | 95.1 /100 | #115 | Exceptional $108,499 |
| Chileans | 95.0 /100 | #116 | Exceptional $108,429 |
| Immigrants | Philippines | 94.6 /100 | #117 | Exceptional $108,288 |
| Ethiopians | 94.5 /100 | #118 | Exceptional $108,251 |
| Sri Lankans | 94.5 /100 | #119 | Exceptional $108,234 |
| Immigrants | Northern Africa | 94.3 /100 | #120 | Exceptional $108,161 |
| Europeans | 94.1 /100 | #121 | Exceptional $108,099 |
| Immigrants | Jordan | 92.9 /100 | #122 | Exceptional $107,715 |
| Carpatho Rusyns | 92.2 /100 | #123 | Exceptional $107,502 |
Demographics Similar to Irish by Median Family Income
In terms of median family income, the demographic groups most similar to Irish are Peruvian ($105,444, a difference of 0.010%), Immigrants from Germany ($105,507, a difference of 0.050%), Hungarian ($105,609, a difference of 0.15%), Immigrants from Albania ($105,285, a difference of 0.16%), and Immigrants from Chile ($105,655, a difference of 0.19%).
| Demographics | Rating | Rank | Median Family Income |
| Tongans | 84.3 /100 | #143 | Excellent $105,967 |
| Immigrants | Morocco | 84.3 /100 | #144 | Excellent $105,964 |
| Danes | 83.8 /100 | #145 | Excellent $105,900 |
| Czechs | 83.4 /100 | #146 | Excellent $105,839 |
| Immigrants | Chile | 82.1 /100 | #147 | Excellent $105,655 |
| Hungarians | 81.7 /100 | #148 | Excellent $105,609 |
| Immigrants | Germany | 80.9 /100 | #149 | Excellent $105,507 |
| Irish | 80.5 /100 | #150 | Excellent $105,453 |
| Peruvians | 80.4 /100 | #151 | Excellent $105,444 |
| Immigrants | Albania | 79.1 /100 | #152 | Good $105,285 |
| Slavs | 77.9 /100 | #153 | Good $105,144 |
| Immigrants | Nepal | 76.3 /100 | #154 | Good $104,966 |
| Native Hawaiians | 75.8 /100 | #155 | Good $104,910 |
| Basques | 74.4 /100 | #156 | Good $104,760 |
| Moroccans | 71.6 /100 | #157 | Good $104,488 |