Chilean vs Iraqi Median Earnings
COMPARE
Chilean
Iraqi
Median Earnings
Median Earnings Comparison
Chileans
Iraqis
$48,504
MEDIAN EARNINGS
94.8/ 100
METRIC RATING
122nd/ 347
METRIC RANK
$46,140
MEDIAN EARNINGS
39.9/ 100
METRIC RATING
187th/ 347
METRIC RANK
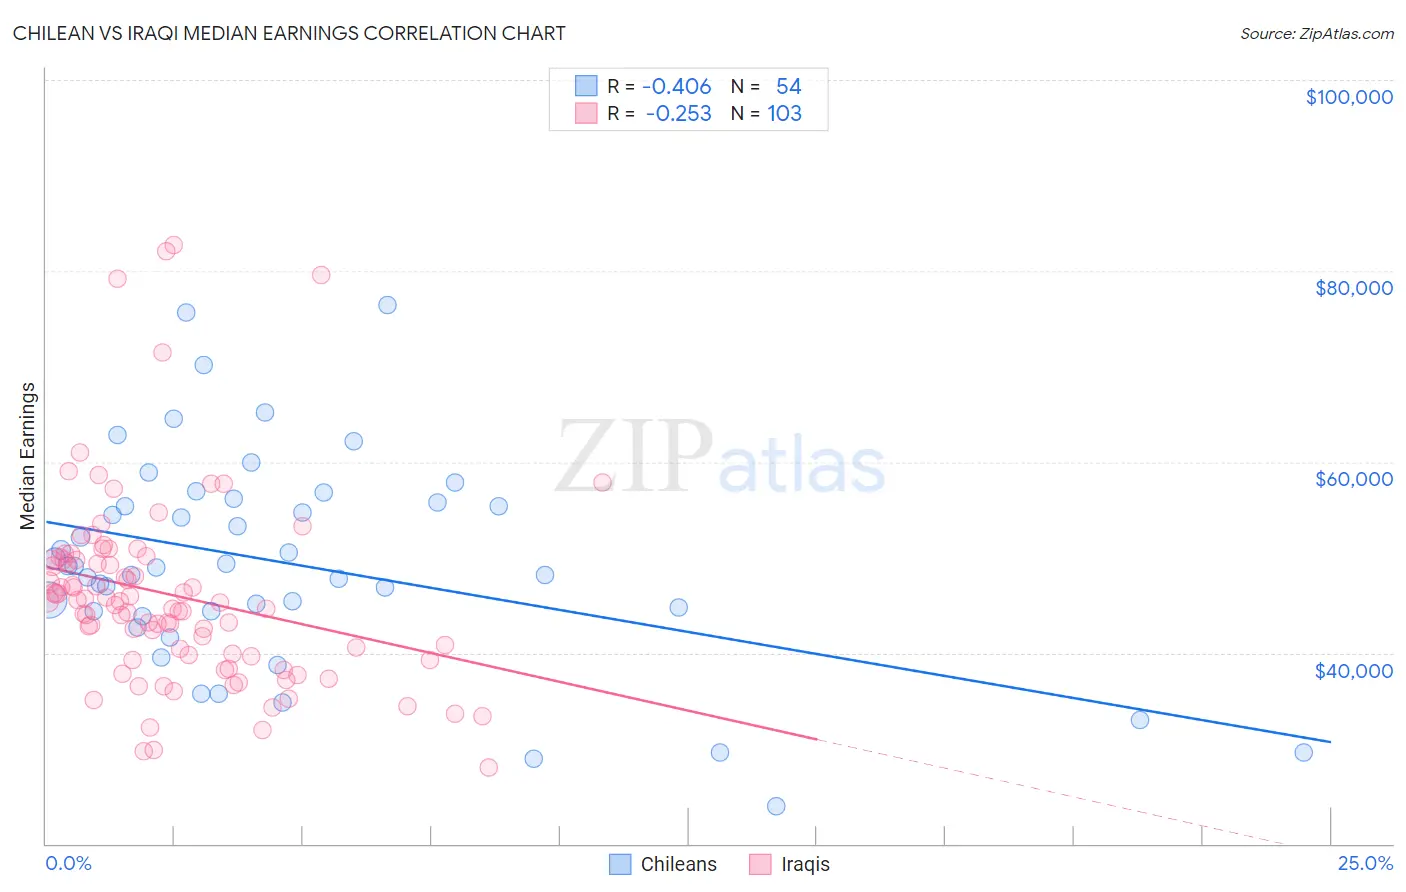
Chilean vs Iraqi Median Earnings Correlation Chart
The statistical analysis conducted on geographies consisting of 256,682,531 people shows a moderate negative correlation between the proportion of Chileans and median earnings in the United States with a correlation coefficient (R) of -0.406 and weighted average of $48,504. Similarly, the statistical analysis conducted on geographies consisting of 170,634,576 people shows a weak negative correlation between the proportion of Iraqis and median earnings in the United States with a correlation coefficient (R) of -0.253 and weighted average of $46,140, a difference of 5.1%.
Median Earnings Correlation Summary
| Measurement | Chilean | Iraqi |
| Minimum | $23,911 | $27,932 |
| Maximum | $76,406 | $82,727 |
| Range | $52,495 | $54,795 |
| Mean | $49,382 | $46,064 |
| Median | $48,999 | $45,313 |
| Interquartile 25% (IQ1) | $44,321 | $39,685 |
| Interquartile 75% (IQ3) | $55,791 | $49,745 |
| Interquartile Range (IQR) | $11,470 | $10,060 |
| Standard Deviation (Sample) | $11,094 | $10,188 |
| Standard Deviation (Population) | $10,991 | $10,138 |
Similar Demographics by Median Earnings
Demographics Similar to Chileans by Median Earnings
In terms of median earnings, the demographic groups most similar to Chileans are Arab ($48,599, a difference of 0.19%), Carpatho Rusyn ($48,617, a difference of 0.23%), Immigrants from Syria ($48,375, a difference of 0.27%), Brazilian ($48,356, a difference of 0.31%), and Polish ($48,659, a difference of 0.32%).
| Demographics | Rating | Rank | Median Earnings |
| Chinese | 96.7 /100 | #115 | Exceptional $48,836 |
| Koreans | 96.2 /100 | #116 | Exceptional $48,727 |
| Serbians | 95.9 /100 | #117 | Exceptional $48,677 |
| Immigrants | Jordan | 95.9 /100 | #118 | Exceptional $48,673 |
| Poles | 95.8 /100 | #119 | Exceptional $48,659 |
| Carpatho Rusyns | 95.5 /100 | #120 | Exceptional $48,617 |
| Arabs | 95.4 /100 | #121 | Exceptional $48,599 |
| Chileans | 94.8 /100 | #122 | Exceptional $48,504 |
| Immigrants | Syria | 93.9 /100 | #123 | Exceptional $48,375 |
| Brazilians | 93.7 /100 | #124 | Exceptional $48,356 |
| Immigrants | Fiji | 93.3 /100 | #125 | Exceptional $48,305 |
| Assyrians/Chaldeans/Syriacs | 93.3 /100 | #126 | Exceptional $48,304 |
| Sierra Leoneans | 93.1 /100 | #127 | Exceptional $48,286 |
| Immigrants | Philippines | 92.9 /100 | #128 | Exceptional $48,266 |
| Pakistanis | 92.8 /100 | #129 | Exceptional $48,254 |
Demographics Similar to Iraqis by Median Earnings
In terms of median earnings, the demographic groups most similar to Iraqis are Vietnamese ($46,172, a difference of 0.070%), Immigrants from Armenia ($46,094, a difference of 0.10%), Uruguayan ($46,190, a difference of 0.11%), Immigrants from Kenya ($46,214, a difference of 0.16%), and Spaniard ($46,059, a difference of 0.18%).
| Demographics | Rating | Rank | Median Earnings |
| Puget Sound Salish | 46.5 /100 | #180 | Average $46,333 |
| Immigrants | Cameroon | 46.4 /100 | #181 | Average $46,329 |
| Swiss | 45.9 /100 | #182 | Average $46,315 |
| French | 45.2 /100 | #183 | Average $46,296 |
| Immigrants | Kenya | 42.4 /100 | #184 | Average $46,214 |
| Uruguayans | 41.6 /100 | #185 | Average $46,190 |
| Vietnamese | 40.9 /100 | #186 | Average $46,172 |
| Iraqis | 39.9 /100 | #187 | Fair $46,140 |
| Immigrants | Armenia | 38.3 /100 | #188 | Fair $46,094 |
| Spaniards | 37.2 /100 | #189 | Fair $46,059 |
| French Canadians | 36.1 /100 | #190 | Fair $46,026 |
| Finns | 33.4 /100 | #191 | Fair $45,940 |
| Germans | 33.2 /100 | #192 | Fair $45,935 |
| Guamanians/Chamorros | 33.2 /100 | #193 | Fair $45,933 |
| Immigrants | Costa Rica | 33.0 /100 | #194 | Fair $45,928 |