Chilean vs French Canadian Householder Income Under 25 years
COMPARE
Chilean
French Canadian
Householder Income Under 25 years
Householder Income Under 25 years Comparison
Chileans
French Canadians
$53,185
HOUSEHOLDER INCOME UNDER 25 YEARS
91.9/ 100
METRIC RATING
135th/ 347
METRIC RANK
$52,672
HOUSEHOLDER INCOME UNDER 25 YEARS
76.5/ 100
METRIC RATING
148th/ 347
METRIC RANK
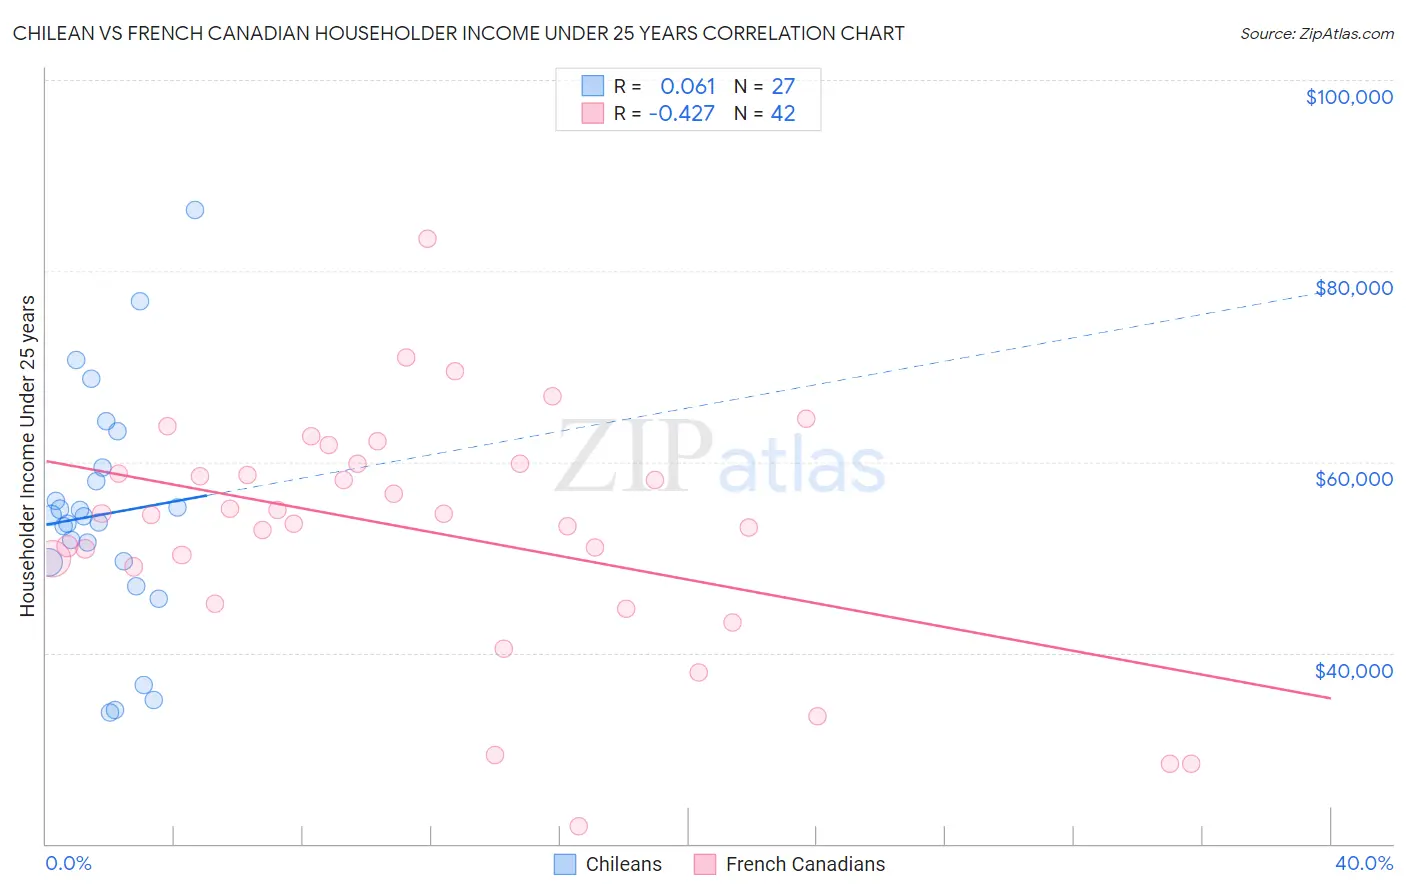
Chilean vs French Canadian Householder Income Under 25 years Correlation Chart
The statistical analysis conducted on geographies consisting of 225,371,987 people shows a slight positive correlation between the proportion of Chileans and household income with householder under the age of 25 in the United States with a correlation coefficient (R) of 0.061 and weighted average of $53,185. Similarly, the statistical analysis conducted on geographies consisting of 404,051,752 people shows a moderate negative correlation between the proportion of French Canadians and household income with householder under the age of 25 in the United States with a correlation coefficient (R) of -0.427 and weighted average of $52,672, a difference of 0.97%.
Householder Income Under 25 years Correlation Summary
| Measurement | Chilean | French Canadian |
| Minimum | $33,789 | $21,875 |
| Maximum | $86,333 | $83,420 |
| Range | $52,544 | $61,545 |
| Mean | $54,520 | $52,741 |
| Median | $54,291 | $54,485 |
| Interquartile 25% (IQ1) | $49,428 | $49,010 |
| Interquartile 75% (IQ3) | $59,351 | $59,797 |
| Interquartile Range (IQR) | $9,923 | $10,788 |
| Standard Deviation (Sample) | $12,299 | $12,369 |
| Standard Deviation (Population) | $12,069 | $12,221 |
Demographics Similar to Chileans and French Canadians by Householder Income Under 25 years
In terms of householder income under 25 years, the demographic groups most similar to Chileans are Immigrants from Northern Africa ($53,185, a difference of 0.0%), Armenian ($53,179, a difference of 0.010%), Immigrants ($53,201, a difference of 0.030%), Immigrants from Barbados ($53,163, a difference of 0.040%), and Norwegian ($53,127, a difference of 0.11%). Similarly, the demographic groups most similar to French Canadians are Scandinavian ($52,654, a difference of 0.030%), Immigrants from Costa Rica ($52,643, a difference of 0.060%), Immigrants from Scotland ($52,638, a difference of 0.060%), Latvian ($52,783, a difference of 0.21%), and Immigrants from Hungary ($52,798, a difference of 0.24%).
| Demographics | Rating | Rank | Householder Income Under 25 years |
| Immigrants | Nicaragua | 93.3 /100 | #131 | Exceptional $53,266 |
| Moroccans | 93.1 /100 | #132 | Exceptional $53,256 |
| Immigrants | Immigrants | 92.2 /100 | #133 | Exceptional $53,201 |
| Immigrants | Northern Africa | 91.9 /100 | #134 | Exceptional $53,185 |
| Chileans | 91.9 /100 | #135 | Exceptional $53,185 |
| Armenians | 91.8 /100 | #136 | Exceptional $53,179 |
| Immigrants | Barbados | 91.5 /100 | #137 | Exceptional $53,163 |
| Norwegians | 90.8 /100 | #138 | Exceptional $53,127 |
| Costa Ricans | 90.4 /100 | #139 | Exceptional $53,106 |
| Hawaiians | 89.8 /100 | #140 | Excellent $53,078 |
| Danes | 88.9 /100 | #141 | Excellent $53,041 |
| Immigrants | Armenia | 87.5 /100 | #142 | Excellent $52,986 |
| Swedes | 87.5 /100 | #143 | Excellent $52,986 |
| South American Indians | 87.3 /100 | #144 | Excellent $52,979 |
| Immigrants | Western Europe | 86.7 /100 | #145 | Excellent $52,957 |
| Immigrants | Hungary | 81.6 /100 | #146 | Excellent $52,798 |
| Latvians | 81.0 /100 | #147 | Excellent $52,783 |
| French Canadians | 76.5 /100 | #148 | Good $52,672 |
| Scandinavians | 75.7 /100 | #149 | Good $52,654 |
| Immigrants | Costa Rica | 75.2 /100 | #150 | Good $52,643 |
| Immigrants | Scotland | 75.0 /100 | #151 | Good $52,638 |