Chilean vs Croatian Per Capita Income
COMPARE
Chilean
Croatian
Per Capita Income
Per Capita Income Comparison
Chileans
Croatians
$46,459
PER CAPITA INCOME
95.9/ 100
METRIC RATING
110th/ 347
METRIC RANK
$47,742
PER CAPITA INCOME
99.0/ 100
METRIC RATING
88th/ 347
METRIC RANK
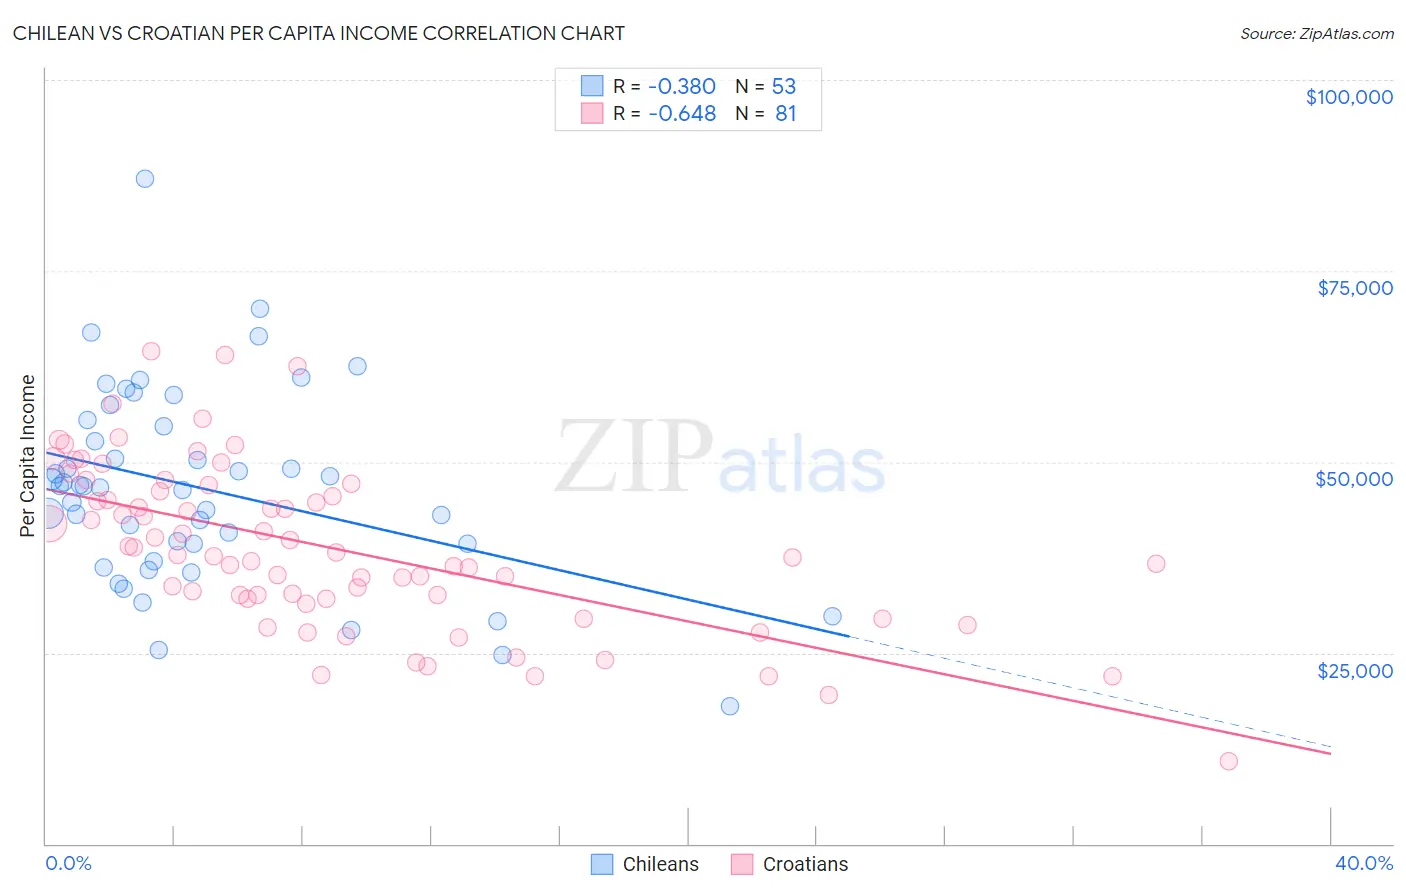
Chilean vs Croatian Per Capita Income Correlation Chart
The statistical analysis conducted on geographies consisting of 256,682,930 people shows a mild negative correlation between the proportion of Chileans and per capita income in the United States with a correlation coefficient (R) of -0.380 and weighted average of $46,459. Similarly, the statistical analysis conducted on geographies consisting of 375,755,176 people shows a significant negative correlation between the proportion of Croatians and per capita income in the United States with a correlation coefficient (R) of -0.648 and weighted average of $47,742, a difference of 2.8%.
Per Capita Income Correlation Summary
| Measurement | Chilean | Croatian |
| Minimum | $18,080 | $10,765 |
| Maximum | $87,144 | $64,427 |
| Range | $69,064 | $53,662 |
| Mean | $46,506 | $38,757 |
| Median | $46,761 | $37,830 |
| Interquartile 25% (IQ1) | $38,083 | $32,092 |
| Interquartile 75% (IQ3) | $55,083 | $46,598 |
| Interquartile Range (IQR) | $17,000 | $14,505 |
| Standard Deviation (Sample) | $12,893 | $10,847 |
| Standard Deviation (Population) | $12,770 | $10,780 |
Similar Demographics by Per Capita Income
Demographics Similar to Chileans by Per Capita Income
In terms of per capita income, the demographic groups most similar to Chileans are Taiwanese ($46,455, a difference of 0.010%), Immigrants from Morocco ($46,430, a difference of 0.060%), Immigrants from Northern Africa ($46,531, a difference of 0.15%), Immigrants from Albania ($46,387, a difference of 0.15%), and Immigrants from Kuwait ($46,543, a difference of 0.18%).
| Demographics | Rating | Rank | Per Capita Income |
| Syrians | 97.2 /100 | #103 | Exceptional $46,837 |
| Brazilians | 96.8 /100 | #104 | Exceptional $46,700 |
| British | 96.3 /100 | #105 | Exceptional $46,571 |
| Ethiopians | 96.3 /100 | #106 | Exceptional $46,569 |
| Serbians | 96.2 /100 | #107 | Exceptional $46,551 |
| Immigrants | Kuwait | 96.2 /100 | #108 | Exceptional $46,543 |
| Immigrants | Northern Africa | 96.2 /100 | #109 | Exceptional $46,531 |
| Chileans | 95.9 /100 | #110 | Exceptional $46,459 |
| Taiwanese | 95.8 /100 | #111 | Exceptional $46,455 |
| Immigrants | Morocco | 95.7 /100 | #112 | Exceptional $46,430 |
| Immigrants | Albania | 95.5 /100 | #113 | Exceptional $46,387 |
| Afghans | 94.9 /100 | #114 | Exceptional $46,268 |
| Immigrants | Chile | 94.6 /100 | #115 | Exceptional $46,213 |
| Poles | 94.1 /100 | #116 | Exceptional $46,123 |
| Chinese | 93.9 /100 | #117 | Exceptional $46,098 |
Demographics Similar to Croatians by Per Capita Income
In terms of per capita income, the demographic groups most similar to Croatians are Northern European ($47,698, a difference of 0.090%), Italian ($47,574, a difference of 0.35%), Macedonian ($47,573, a difference of 0.36%), Immigrants from Moldova ($47,489, a difference of 0.53%), and Ukrainian ($48,014, a difference of 0.57%).
| Demographics | Rating | Rank | Per Capita Income |
| Armenians | 99.4 /100 | #81 | Exceptional $48,287 |
| Immigrants | Indonesia | 99.4 /100 | #82 | Exceptional $48,195 |
| Immigrants | Brazil | 99.4 /100 | #83 | Exceptional $48,164 |
| Immigrants | Ukraine | 99.3 /100 | #84 | Exceptional $48,134 |
| Austrians | 99.3 /100 | #85 | Exceptional $48,116 |
| Immigrants | Southern Europe | 99.3 /100 | #86 | Exceptional $48,027 |
| Ukrainians | 99.3 /100 | #87 | Exceptional $48,014 |
| Croatians | 99.0 /100 | #88 | Exceptional $47,742 |
| Northern Europeans | 98.9 /100 | #89 | Exceptional $47,698 |
| Italians | 98.8 /100 | #90 | Exceptional $47,574 |
| Macedonians | 98.8 /100 | #91 | Exceptional $47,573 |
| Immigrants | Moldova | 98.7 /100 | #92 | Exceptional $47,489 |
| Immigrants | Zimbabwe | 98.5 /100 | #93 | Exceptional $47,394 |
| Albanians | 98.5 /100 | #94 | Exceptional $47,379 |
| Immigrants | Egypt | 98.5 /100 | #95 | Exceptional $47,361 |