Cheyenne vs West Indian Householder Income Over 65 years
COMPARE
Cheyenne
West Indian
Householder Income Over 65 years
Householder Income Over 65 years Comparison
Cheyenne
West Indians
$54,096
HOUSEHOLDER INCOME OVER 65 YEARS
0.1/ 100
METRIC RATING
277th/ 347
METRIC RANK
$54,936
HOUSEHOLDER INCOME OVER 65 YEARS
0.2/ 100
METRIC RATING
259th/ 347
METRIC RANK
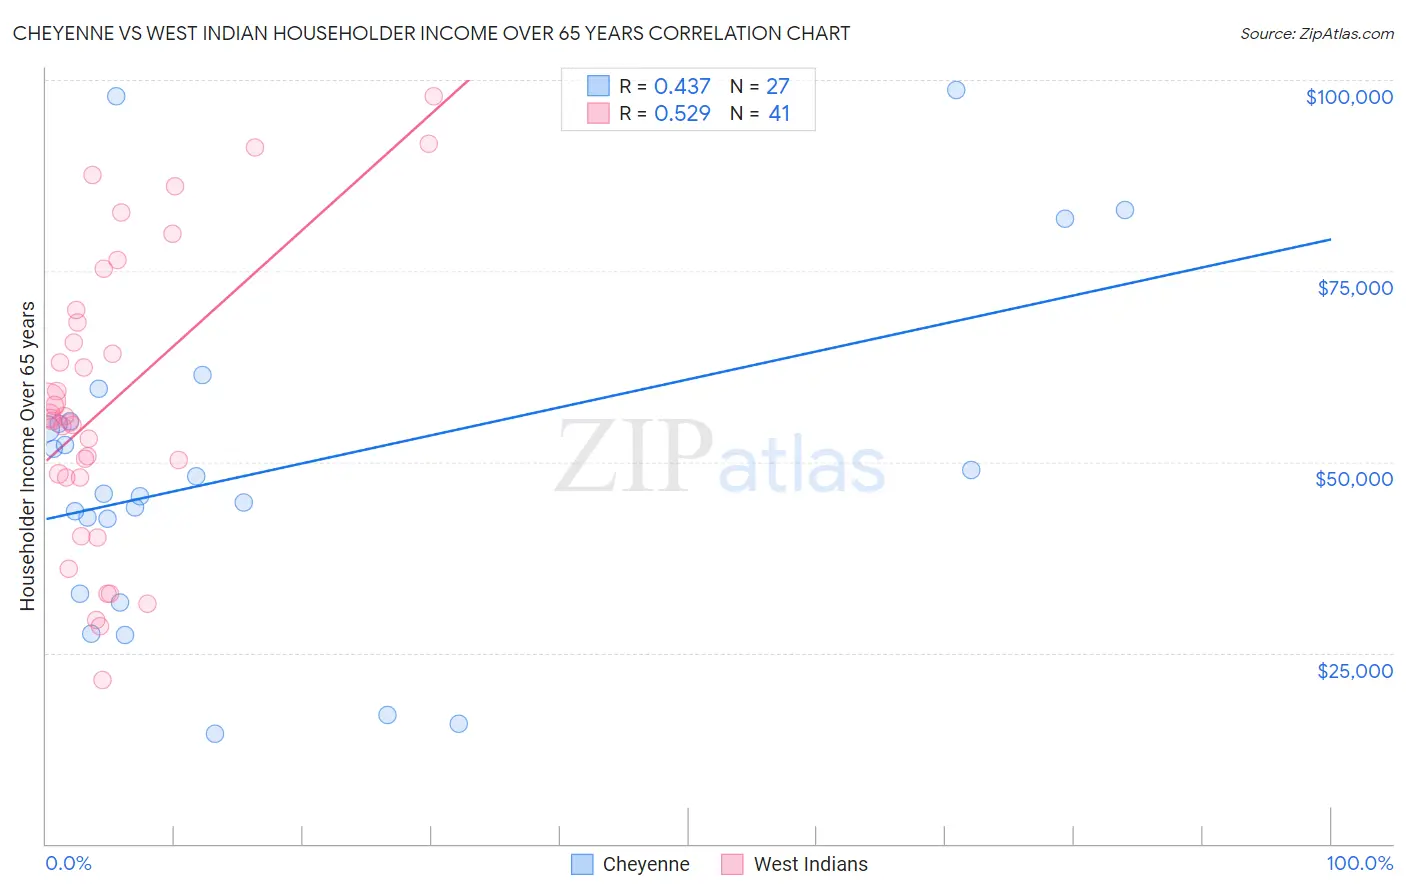
Cheyenne vs West Indian Householder Income Over 65 years Correlation Chart
The statistical analysis conducted on geographies consisting of 80,656,378 people shows a moderate positive correlation between the proportion of Cheyenne and household income with householder over the age of 65 in the United States with a correlation coefficient (R) of 0.437 and weighted average of $54,096. Similarly, the statistical analysis conducted on geographies consisting of 253,324,861 people shows a substantial positive correlation between the proportion of West Indians and household income with householder over the age of 65 in the United States with a correlation coefficient (R) of 0.529 and weighted average of $54,936, a difference of 1.5%.
Householder Income Over 65 years Correlation Summary
| Measurement | Cheyenne | West Indian |
| Minimum | $14,422 | $21,368 |
| Maximum | $98,750 | $97,868 |
| Range | $84,328 | $76,500 |
| Mean | $48,996 | $57,688 |
| Median | $45,764 | $55,650 |
| Interquartile 25% (IQ1) | $32,697 | $47,931 |
| Interquartile 75% (IQ3) | $55,318 | $69,062 |
| Interquartile Range (IQR) | $22,620 | $21,132 |
| Standard Deviation (Sample) | $21,930 | $18,888 |
| Standard Deviation (Population) | $21,520 | $18,656 |
Demographics Similar to Cheyenne and West Indians by Householder Income Over 65 years
In terms of householder income over 65 years, the demographic groups most similar to Cheyenne are Cree ($54,129, a difference of 0.060%), Cherokee ($54,133, a difference of 0.070%), Barbadian ($54,163, a difference of 0.12%), Immigrants from Ecuador ($54,030, a difference of 0.12%), and Indonesian ($54,176, a difference of 0.15%). Similarly, the demographic groups most similar to West Indians are Immigrants from West Indies ($54,927, a difference of 0.020%), Comanche ($54,922, a difference of 0.030%), Ecuadorian ($54,958, a difference of 0.040%), Bangladeshi ($54,719, a difference of 0.40%), and French American Indian ($54,699, a difference of 0.43%).
| Demographics | Rating | Rank | Householder Income Over 65 years |
| Ecuadorians | 0.2 /100 | #258 | Tragic $54,958 |
| West Indians | 0.2 /100 | #259 | Tragic $54,936 |
| Immigrants | West Indies | 0.2 /100 | #260 | Tragic $54,927 |
| Comanche | 0.2 /100 | #261 | Tragic $54,922 |
| Bangladeshis | 0.1 /100 | #262 | Tragic $54,719 |
| French American Indians | 0.1 /100 | #263 | Tragic $54,699 |
| Apache | 0.1 /100 | #264 | Tragic $54,668 |
| Belizeans | 0.1 /100 | #265 | Tragic $54,580 |
| Jamaicans | 0.1 /100 | #266 | Tragic $54,560 |
| Guatemalans | 0.1 /100 | #267 | Tragic $54,526 |
| Immigrants | Zaire | 0.1 /100 | #268 | Tragic $54,512 |
| Nicaraguans | 0.1 /100 | #269 | Tragic $54,474 |
| Immigrants | Senegal | 0.1 /100 | #270 | Tragic $54,447 |
| Liberians | 0.1 /100 | #271 | Tragic $54,356 |
| Potawatomi | 0.1 /100 | #272 | Tragic $54,212 |
| Indonesians | 0.1 /100 | #273 | Tragic $54,176 |
| Barbadians | 0.1 /100 | #274 | Tragic $54,163 |
| Cherokee | 0.1 /100 | #275 | Tragic $54,133 |
| Cree | 0.1 /100 | #276 | Tragic $54,129 |
| Cheyenne | 0.1 /100 | #277 | Tragic $54,096 |
| Immigrants | Ecuador | 0.1 /100 | #278 | Tragic $54,030 |