Cherokee vs Immigrants from Liberia Householder Income Ages 25 - 44 years
COMPARE
Cherokee
Immigrants from Liberia
Householder Income Ages 25 - 44 years
Householder Income Ages 25 - 44 years Comparison
Cherokee
Immigrants from Liberia
$80,843
HOUSEHOLDER INCOME AGES 25 - 44 YEARS
0.0/ 100
METRIC RATING
300th/ 347
METRIC RANK
$80,863
HOUSEHOLDER INCOME AGES 25 - 44 YEARS
0.1/ 100
METRIC RATING
299th/ 347
METRIC RANK
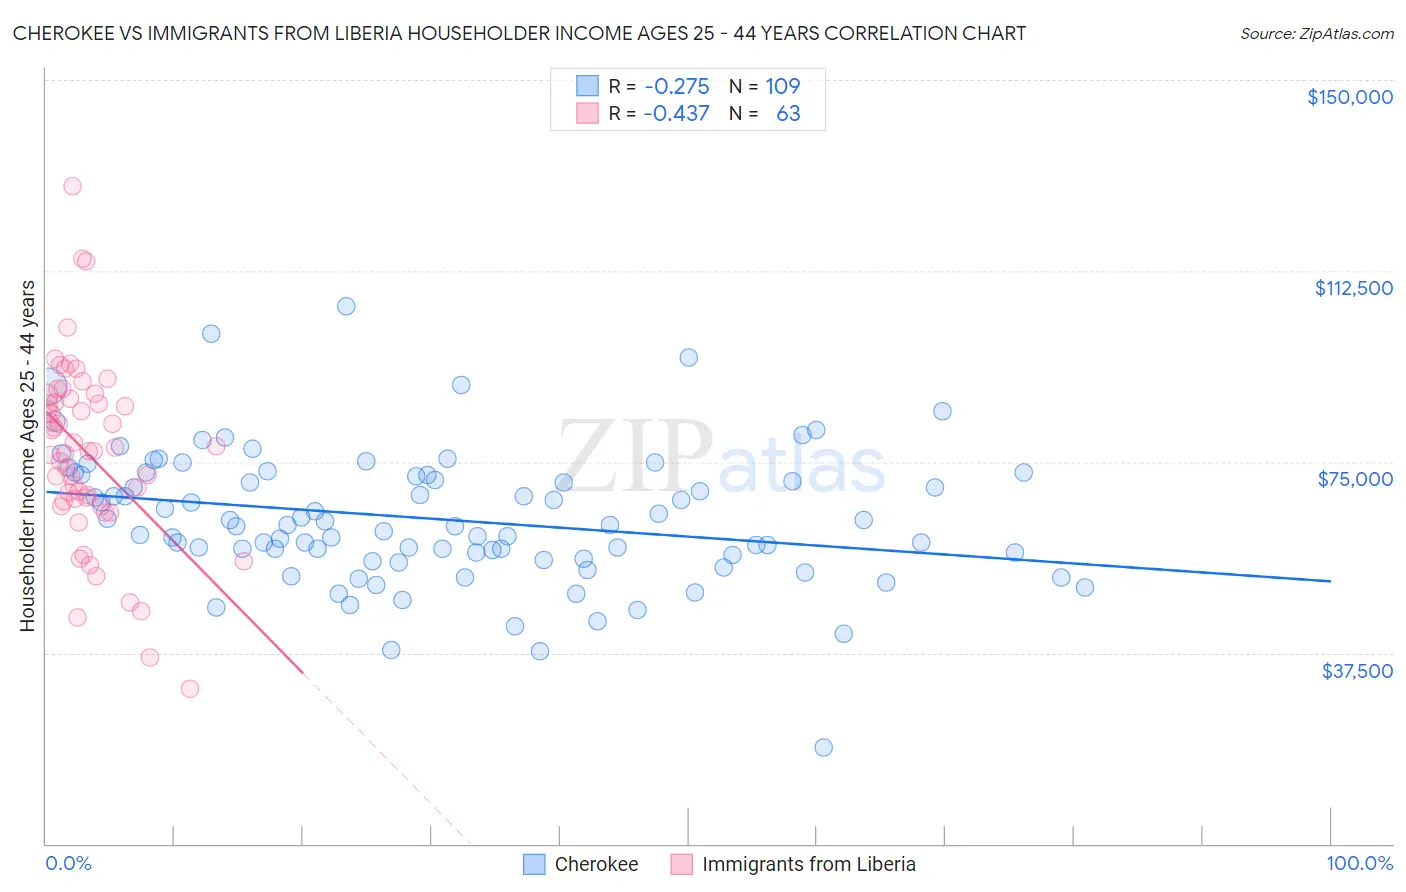
Cherokee vs Immigrants from Liberia Householder Income Ages 25 - 44 years Correlation Chart
The statistical analysis conducted on geographies consisting of 490,925,760 people shows a weak negative correlation between the proportion of Cherokee and household income with householder between the ages 25 and 44 in the United States with a correlation coefficient (R) of -0.275 and weighted average of $80,843. Similarly, the statistical analysis conducted on geographies consisting of 135,196,849 people shows a moderate negative correlation between the proportion of Immigrants from Liberia and household income with householder between the ages 25 and 44 in the United States with a correlation coefficient (R) of -0.437 and weighted average of $80,863, a difference of 0.020%.
Householder Income Ages 25 - 44 years Correlation Summary
| Measurement | Cherokee | Immigrants from Liberia |
| Minimum | $18,882 | $30,517 |
| Maximum | $105,572 | $129,042 |
| Range | $86,690 | $98,525 |
| Mean | $63,770 | $76,665 |
| Median | $62,500 | $77,079 |
| Interquartile 25% (IQ1) | $56,304 | $67,377 |
| Interquartile 75% (IQ3) | $72,426 | $87,370 |
| Interquartile Range (IQR) | $16,122 | $19,994 |
| Standard Deviation (Sample) | $13,175 | $17,857 |
| Standard Deviation (Population) | $13,114 | $17,715 |
Demographics Similar to Cherokee and Immigrants from Liberia by Householder Income Ages 25 - 44 years
In terms of householder income ages 25 - 44 years, the demographic groups most similar to Cherokee are Immigrants from Micronesia ($80,544, a difference of 0.37%), Hispanic or Latino ($80,515, a difference of 0.41%), Dominican ($81,229, a difference of 0.48%), Mexican ($80,427, a difference of 0.52%), and Immigrants from Guatemala ($81,341, a difference of 0.62%). Similarly, the demographic groups most similar to Immigrants from Liberia are Immigrants from Micronesia ($80,544, a difference of 0.40%), Hispanic or Latino ($80,515, a difference of 0.43%), Dominican ($81,229, a difference of 0.45%), Mexican ($80,427, a difference of 0.54%), and Immigrants from Guatemala ($81,341, a difference of 0.59%).
| Demographics | Rating | Rank | Householder Income Ages 25 - 44 years |
| Shoshone | 0.1 /100 | #289 | Tragic $82,062 |
| Liberians | 0.1 /100 | #290 | Tragic $82,005 |
| Potawatomi | 0.1 /100 | #291 | Tragic $81,774 |
| Yaqui | 0.1 /100 | #292 | Tragic $81,656 |
| Blackfeet | 0.1 /100 | #293 | Tragic $81,531 |
| Cubans | 0.1 /100 | #294 | Tragic $81,483 |
| Bangladeshis | 0.1 /100 | #295 | Tragic $81,363 |
| Immigrants | Dominica | 0.1 /100 | #296 | Tragic $81,351 |
| Immigrants | Guatemala | 0.1 /100 | #297 | Tragic $81,341 |
| Dominicans | 0.1 /100 | #298 | Tragic $81,229 |
| Immigrants | Liberia | 0.1 /100 | #299 | Tragic $80,863 |
| Cherokee | 0.0 /100 | #300 | Tragic $80,843 |
| Immigrants | Micronesia | 0.0 /100 | #301 | Tragic $80,544 |
| Hispanics or Latinos | 0.0 /100 | #302 | Tragic $80,515 |
| Mexicans | 0.0 /100 | #303 | Tragic $80,427 |
| Immigrants | Caribbean | 0.0 /100 | #304 | Tragic $80,326 |
| Immigrants | Dominican Republic | 0.0 /100 | #305 | Tragic $80,319 |
| Apache | 0.0 /100 | #306 | Tragic $80,260 |
| Haitians | 0.0 /100 | #307 | Tragic $80,055 |
| Immigrants | Central America | 0.0 /100 | #308 | Tragic $80,012 |
| Chippewa | 0.0 /100 | #309 | Tragic $80,005 |