Cherokee vs Immigrants from Guatemala Median Female Earnings
COMPARE
Cherokee
Immigrants from Guatemala
Median Female Earnings
Median Female Earnings Comparison
Cherokee
Immigrants from Guatemala
$34,742
MEDIAN FEMALE EARNINGS
0.0/ 100
METRIC RATING
316th/ 347
METRIC RANK
$35,444
MEDIAN FEMALE EARNINGS
0.0/ 100
METRIC RATING
299th/ 347
METRIC RANK
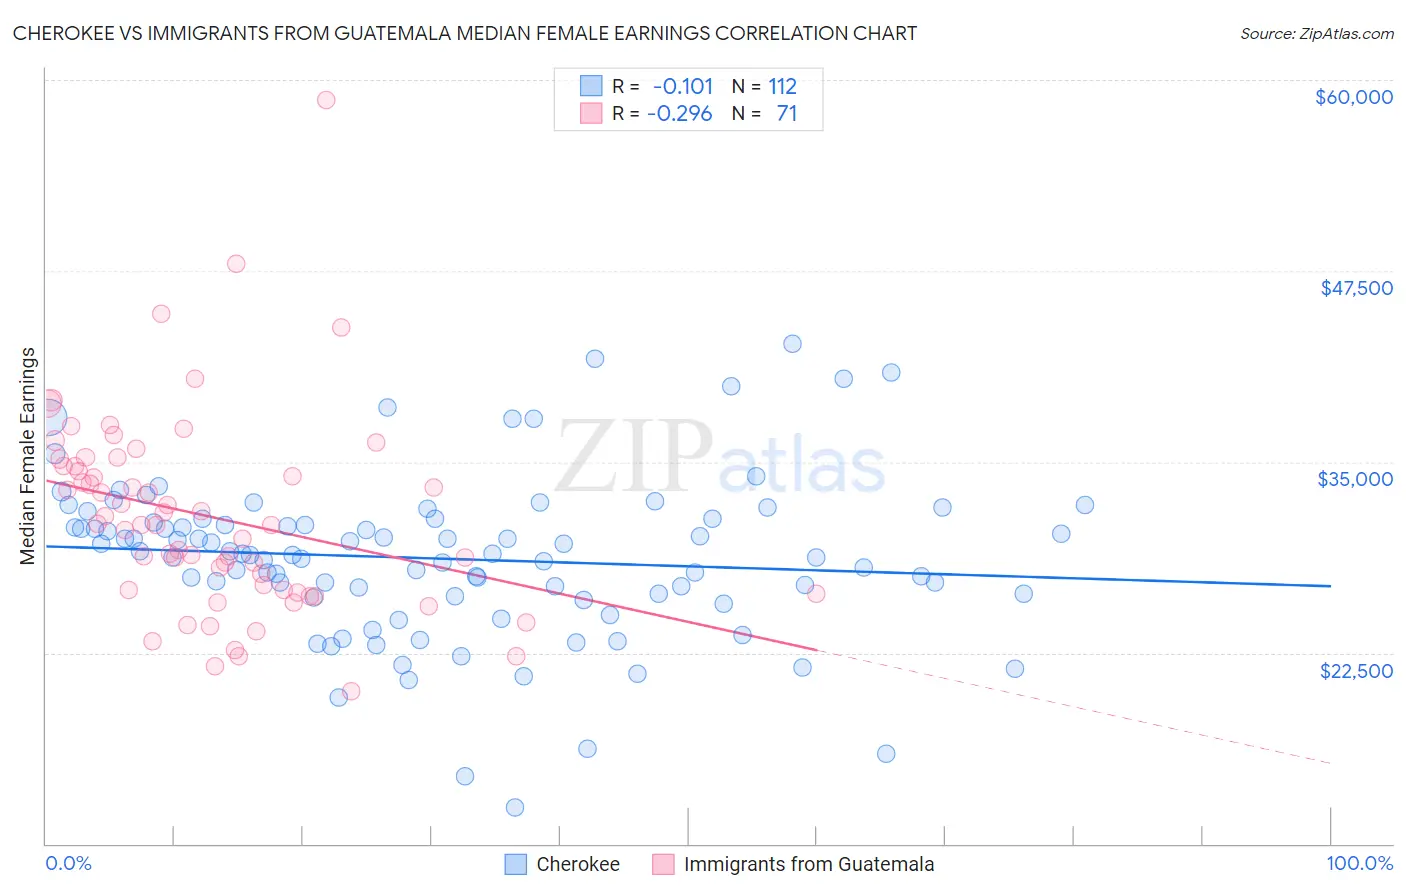
Cherokee vs Immigrants from Guatemala Median Female Earnings Correlation Chart
The statistical analysis conducted on geographies consisting of 492,961,195 people shows a poor negative correlation between the proportion of Cherokee and median female earnings in the United States with a correlation coefficient (R) of -0.101 and weighted average of $34,742. Similarly, the statistical analysis conducted on geographies consisting of 377,157,500 people shows a weak negative correlation between the proportion of Immigrants from Guatemala and median female earnings in the United States with a correlation coefficient (R) of -0.296 and weighted average of $35,444, a difference of 2.0%.
Median Female Earnings Correlation Summary
| Measurement | Cherokee | Immigrants from Guatemala |
| Minimum | $12,396 | $20,000 |
| Maximum | $42,750 | $58,669 |
| Range | $30,354 | $38,669 |
| Mean | $28,662 | $31,424 |
| Median | $28,960 | $30,854 |
| Interquartile 25% (IQ1) | $26,268 | $26,583 |
| Interquartile 75% (IQ3) | $31,156 | $34,723 |
| Interquartile Range (IQR) | $4,888 | $8,140 |
| Standard Deviation (Sample) | $5,298 | $6,504 |
| Standard Deviation (Population) | $5,275 | $6,458 |
Demographics Similar to Cherokee and Immigrants from Guatemala by Median Female Earnings
In terms of median female earnings, the demographic groups most similar to Cherokee are Potawatomi ($34,739, a difference of 0.010%), Pennsylvania German ($34,802, a difference of 0.17%), Apache ($34,895, a difference of 0.44%), Yaqui ($34,943, a difference of 0.58%), and Cuban ($34,942, a difference of 0.58%). Similarly, the demographic groups most similar to Immigrants from Guatemala are Immigrants from Micronesia ($35,477, a difference of 0.090%), Hmong ($35,498, a difference of 0.15%), Yuman ($35,377, a difference of 0.19%), Pima ($35,326, a difference of 0.33%), and Black/African American ($35,315, a difference of 0.36%).
| Demographics | Rating | Rank | Median Female Earnings |
| Hmong | 0.0 /100 | #297 | Tragic $35,498 |
| Immigrants | Micronesia | 0.0 /100 | #298 | Tragic $35,477 |
| Immigrants | Guatemala | 0.0 /100 | #299 | Tragic $35,444 |
| Yuman | 0.0 /100 | #300 | Tragic $35,377 |
| Pima | 0.0 /100 | #301 | Tragic $35,326 |
| Blacks/African Americans | 0.0 /100 | #302 | Tragic $35,315 |
| Immigrants | Latin America | 0.0 /100 | #303 | Tragic $35,307 |
| Crow | 0.0 /100 | #304 | Tragic $35,266 |
| Bahamians | 0.0 /100 | #305 | Tragic $35,125 |
| Fijians | 0.0 /100 | #306 | Tragic $35,114 |
| Sioux | 0.0 /100 | #307 | Tragic $35,063 |
| Immigrants | Bahamas | 0.0 /100 | #308 | Tragic $35,027 |
| Hondurans | 0.0 /100 | #309 | Tragic $35,013 |
| Chippewa | 0.0 /100 | #310 | Tragic $35,003 |
| Ute | 0.0 /100 | #311 | Tragic $34,960 |
| Yaqui | 0.0 /100 | #312 | Tragic $34,943 |
| Cubans | 0.0 /100 | #313 | Tragic $34,942 |
| Apache | 0.0 /100 | #314 | Tragic $34,895 |
| Pennsylvania Germans | 0.0 /100 | #315 | Tragic $34,802 |
| Cherokee | 0.0 /100 | #316 | Tragic $34,742 |
| Potawatomi | 0.0 /100 | #317 | Tragic $34,739 |