Central American vs Paraguayan Householder Income Ages 25 - 44 years
COMPARE
Central American
Paraguayan
Householder Income Ages 25 - 44 years
Householder Income Ages 25 - 44 years Comparison
Central Americans
Paraguayans
$85,144
HOUSEHOLDER INCOME AGES 25 - 44 YEARS
0.5/ 100
METRIC RATING
256th/ 347
METRIC RANK
$106,615
HOUSEHOLDER INCOME AGES 25 - 44 YEARS
99.9/ 100
METRIC RATING
54th/ 347
METRIC RANK
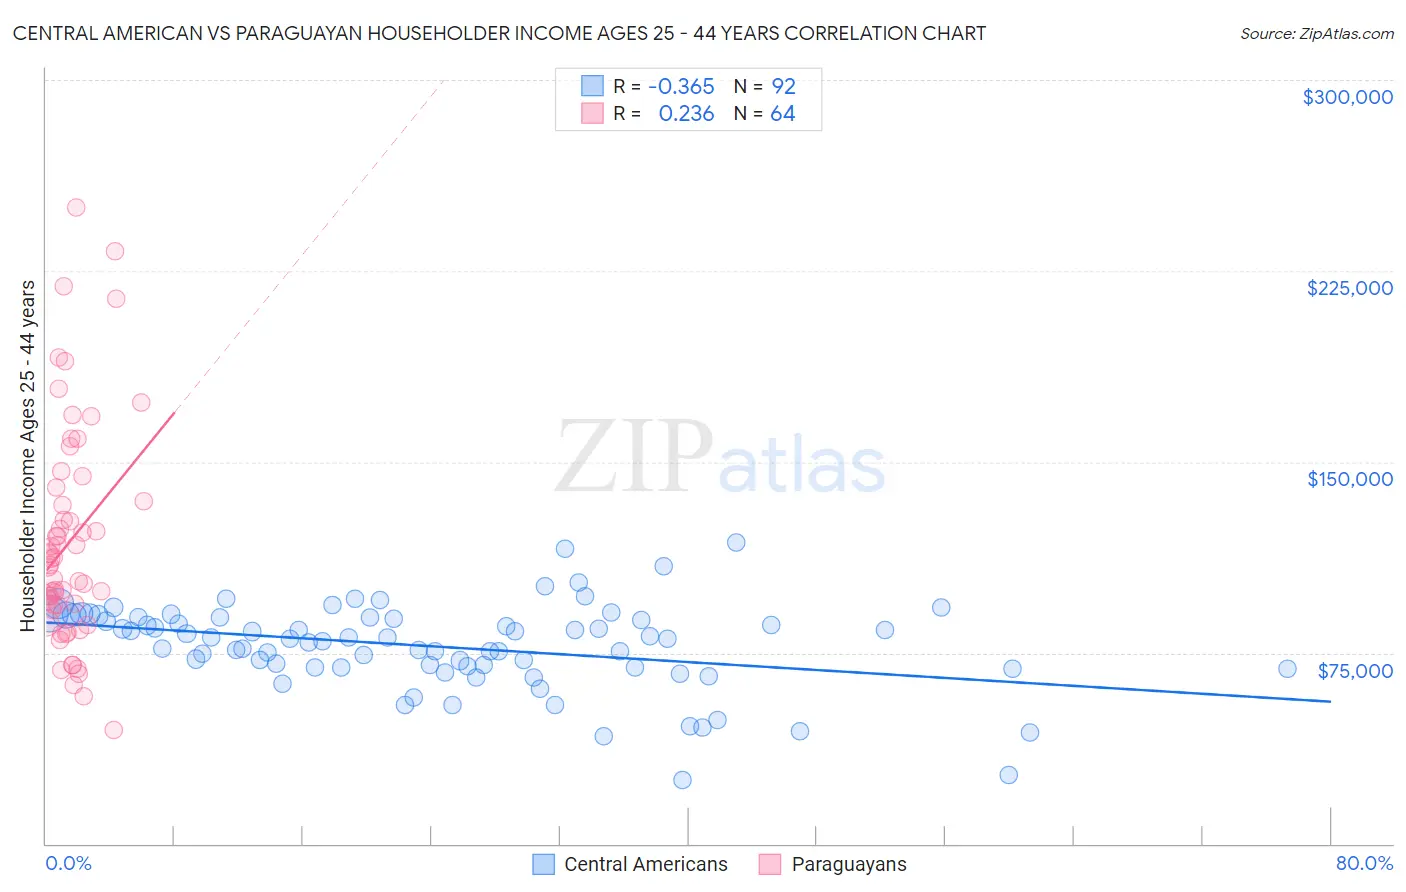
Central American vs Paraguayan Householder Income Ages 25 - 44 years Correlation Chart
The statistical analysis conducted on geographies consisting of 502,385,785 people shows a mild negative correlation between the proportion of Central Americans and household income with householder between the ages 25 and 44 in the United States with a correlation coefficient (R) of -0.365 and weighted average of $85,144. Similarly, the statistical analysis conducted on geographies consisting of 95,064,086 people shows a weak positive correlation between the proportion of Paraguayans and household income with householder between the ages 25 and 44 in the United States with a correlation coefficient (R) of 0.236 and weighted average of $106,615, a difference of 25.2%.
Householder Income Ages 25 - 44 years Correlation Summary
| Measurement | Central American | Paraguayan |
| Minimum | $25,224 | $44,531 |
| Maximum | $118,125 | $250,001 |
| Range | $92,901 | $205,470 |
| Mean | $77,483 | $118,848 |
| Median | $80,487 | $110,860 |
| Interquartile 25% (IQ1) | $69,364 | $92,713 |
| Interquartile 75% (IQ3) | $88,864 | $137,201 |
| Interquartile Range (IQR) | $19,500 | $44,488 |
| Standard Deviation (Sample) | $16,910 | $43,421 |
| Standard Deviation (Population) | $16,818 | $43,080 |
Similar Demographics by Householder Income Ages 25 - 44 years
Demographics Similar to Central Americans by Householder Income Ages 25 - 44 years
In terms of householder income ages 25 - 44 years, the demographic groups most similar to Central Americans are German Russian ($85,220, a difference of 0.090%), Mexican American Indian ($85,066, a difference of 0.090%), Immigrants from Nicaragua ($84,914, a difference of 0.27%), Immigrants from Senegal ($84,848, a difference of 0.35%), and American ($84,791, a difference of 0.42%).
| Demographics | Rating | Rank | Householder Income Ages 25 - 44 years |
| French American Indians | 0.8 /100 | #249 | Tragic $85,899 |
| Pennsylvania Germans | 0.8 /100 | #250 | Tragic $85,836 |
| Cape Verdeans | 0.8 /100 | #251 | Tragic $85,758 |
| Immigrants | Western Africa | 0.7 /100 | #252 | Tragic $85,676 |
| British West Indians | 0.7 /100 | #253 | Tragic $85,565 |
| Immigrants | Laos | 0.7 /100 | #254 | Tragic $85,553 |
| German Russians | 0.6 /100 | #255 | Tragic $85,220 |
| Central Americans | 0.5 /100 | #256 | Tragic $85,144 |
| Mexican American Indians | 0.5 /100 | #257 | Tragic $85,066 |
| Immigrants | Nicaragua | 0.5 /100 | #258 | Tragic $84,914 |
| Immigrants | Senegal | 0.5 /100 | #259 | Tragic $84,848 |
| Americans | 0.4 /100 | #260 | Tragic $84,791 |
| Inupiat | 0.4 /100 | #261 | Tragic $84,619 |
| Cree | 0.4 /100 | #262 | Tragic $84,574 |
| Belizeans | 0.4 /100 | #263 | Tragic $84,534 |
Demographics Similar to Paraguayans by Householder Income Ages 25 - 44 years
In terms of householder income ages 25 - 44 years, the demographic groups most similar to Paraguayans are Immigrants from Norway ($106,629, a difference of 0.010%), Greek ($106,457, a difference of 0.15%), Immigrants from Europe ($106,817, a difference of 0.19%), Immigrants from Czechoslovakia ($106,888, a difference of 0.26%), and Immigrants from Pakistan ($106,129, a difference of 0.46%).
| Demographics | Rating | Rank | Householder Income Ages 25 - 44 years |
| Estonians | 99.9 /100 | #47 | Exceptional $107,269 |
| Bulgarians | 99.9 /100 | #48 | Exceptional $107,264 |
| Immigrants | Turkey | 99.9 /100 | #49 | Exceptional $107,258 |
| Cambodians | 99.9 /100 | #50 | Exceptional $107,148 |
| Immigrants | Czechoslovakia | 99.9 /100 | #51 | Exceptional $106,888 |
| Immigrants | Europe | 99.9 /100 | #52 | Exceptional $106,817 |
| Immigrants | Norway | 99.9 /100 | #53 | Exceptional $106,629 |
| Paraguayans | 99.9 /100 | #54 | Exceptional $106,615 |
| Greeks | 99.9 /100 | #55 | Exceptional $106,457 |
| Immigrants | Pakistan | 99.8 /100 | #56 | Exceptional $106,129 |
| Immigrants | Austria | 99.8 /100 | #57 | Exceptional $106,103 |
| Immigrants | South Africa | 99.8 /100 | #58 | Exceptional $105,748 |
| Immigrants | Latvia | 99.8 /100 | #59 | Exceptional $105,522 |
| Egyptians | 99.7 /100 | #60 | Exceptional $105,282 |
| Lithuanians | 99.7 /100 | #61 | Exceptional $105,223 |