Central American vs Immigrants from Eritrea Householder Income Ages 45 - 64 years
COMPARE
Central American
Immigrants from Eritrea
Householder Income Ages 45 - 64 years
Householder Income Ages 45 - 64 years Comparison
Central Americans
Immigrants from Eritrea
$90,951
HOUSEHOLDER INCOME AGES 45 - 64 YEARS
0.9/ 100
METRIC RATING
246th/ 347
METRIC RANK
$97,373
HOUSEHOLDER INCOME AGES 45 - 64 YEARS
18.6/ 100
METRIC RATING
204th/ 347
METRIC RANK
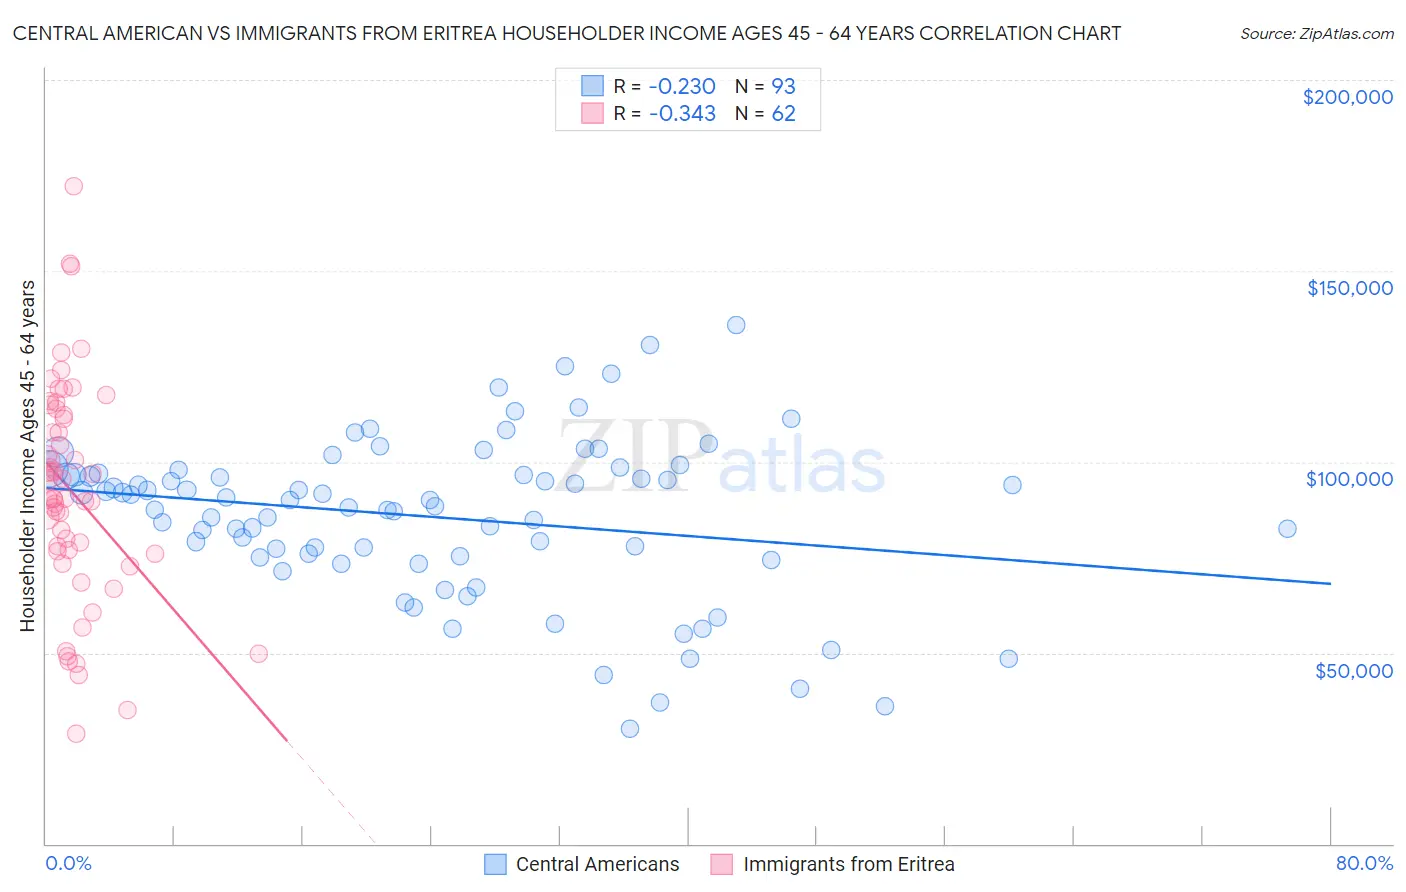
Central American vs Immigrants from Eritrea Householder Income Ages 45 - 64 years Correlation Chart
The statistical analysis conducted on geographies consisting of 502,874,075 people shows a weak negative correlation between the proportion of Central Americans and household income with householder between the ages 45 and 64 in the United States with a correlation coefficient (R) of -0.230 and weighted average of $90,951. Similarly, the statistical analysis conducted on geographies consisting of 104,839,257 people shows a mild negative correlation between the proportion of Immigrants from Eritrea and household income with householder between the ages 45 and 64 in the United States with a correlation coefficient (R) of -0.343 and weighted average of $97,373, a difference of 7.1%.
Householder Income Ages 45 - 64 years Correlation Summary
| Measurement | Central American | Immigrants from Eritrea |
| Minimum | $30,221 | $28,839 |
| Maximum | $135,944 | $172,216 |
| Range | $105,723 | $143,377 |
| Mean | $85,574 | $92,178 |
| Median | $89,913 | $90,363 |
| Interquartile 25% (IQ1) | $75,128 | $76,571 |
| Interquartile 75% (IQ3) | $96,782 | $112,271 |
| Interquartile Range (IQR) | $21,654 | $35,701 |
| Standard Deviation (Sample) | $20,953 | $28,505 |
| Standard Deviation (Population) | $20,840 | $28,274 |
Similar Demographics by Householder Income Ages 45 - 64 years
Demographics Similar to Central Americans by Householder Income Ages 45 - 64 years
In terms of householder income ages 45 - 64 years, the demographic groups most similar to Central Americans are Alaskan Athabascan ($90,951, a difference of 0.0%), Guyanese ($90,966, a difference of 0.020%), Immigrants from Laos ($90,909, a difference of 0.050%), Mexican American Indian ($90,811, a difference of 0.15%), and Subsaharan African ($90,691, a difference of 0.29%).
| Demographics | Rating | Rank | Householder Income Ages 45 - 64 years |
| Immigrants | Ecuador | 1.2 /100 | #239 | Tragic $91,462 |
| Immigrants | Burma/Myanmar | 1.1 /100 | #240 | Tragic $91,385 |
| Trinidadians and Tobagonians | 1.1 /100 | #241 | Tragic $91,357 |
| Inupiat | 1.1 /100 | #242 | Tragic $91,355 |
| Immigrants | Trinidad and Tobago | 1.1 /100 | #243 | Tragic $91,347 |
| Immigrants | Middle Africa | 1.1 /100 | #244 | Tragic $91,293 |
| Guyanese | 0.9 /100 | #245 | Tragic $90,966 |
| Central Americans | 0.9 /100 | #246 | Tragic $90,951 |
| Alaskan Athabascans | 0.9 /100 | #247 | Tragic $90,951 |
| Immigrants | Laos | 0.9 /100 | #248 | Tragic $90,909 |
| Mexican American Indians | 0.8 /100 | #249 | Tragic $90,811 |
| Sub-Saharan Africans | 0.8 /100 | #250 | Tragic $90,691 |
| Americans | 0.7 /100 | #251 | Tragic $90,536 |
| Marshallese | 0.7 /100 | #252 | Tragic $90,455 |
| Barbadians | 0.6 /100 | #253 | Tragic $90,266 |
Demographics Similar to Immigrants from Eritrea by Householder Income Ages 45 - 64 years
In terms of householder income ages 45 - 64 years, the demographic groups most similar to Immigrants from Eritrea are Immigrants from Thailand ($97,400, a difference of 0.030%), Tlingit-Haida ($97,417, a difference of 0.040%), Immigrants from Colombia ($97,290, a difference of 0.090%), Immigrants from Africa ($97,284, a difference of 0.090%), and Ghanaian ($97,277, a difference of 0.10%).
| Demographics | Rating | Rank | Householder Income Ages 45 - 64 years |
| Puget Sound Salish | 27.0 /100 | #197 | Fair $98,340 |
| Immigrants | Iraq | 25.7 /100 | #198 | Fair $98,201 |
| Whites/Caucasians | 24.6 /100 | #199 | Fair $98,091 |
| Immigrants | Kenya | 23.5 /100 | #200 | Fair $97,964 |
| Yugoslavians | 20.0 /100 | #201 | Fair $97,558 |
| Tlingit-Haida | 18.9 /100 | #202 | Poor $97,417 |
| Immigrants | Thailand | 18.8 /100 | #203 | Poor $97,400 |
| Immigrants | Eritrea | 18.6 /100 | #204 | Poor $97,373 |
| Immigrants | Colombia | 18.0 /100 | #205 | Poor $97,290 |
| Immigrants | Africa | 17.9 /100 | #206 | Poor $97,284 |
| Ghanaians | 17.9 /100 | #207 | Poor $97,277 |
| Scotch-Irish | 16.4 /100 | #208 | Poor $97,073 |
| Japanese | 14.8 /100 | #209 | Poor $96,834 |
| Tsimshian | 14.5 /100 | #210 | Poor $96,783 |
| Immigrants | Cambodia | 13.0 /100 | #211 | Poor $96,537 |