Celtic vs Swiss Median Family Income
COMPARE
Celtic
Swiss
Median Family Income
Median Family Income Comparison
Celtics
Swiss
$101,139
MEDIAN FAMILY INCOME
31.3/ 100
METRIC RATING
186th/ 347
METRIC RANK
$104,396
MEDIAN FAMILY INCOME
70.7/ 100
METRIC RATING
159th/ 347
METRIC RANK
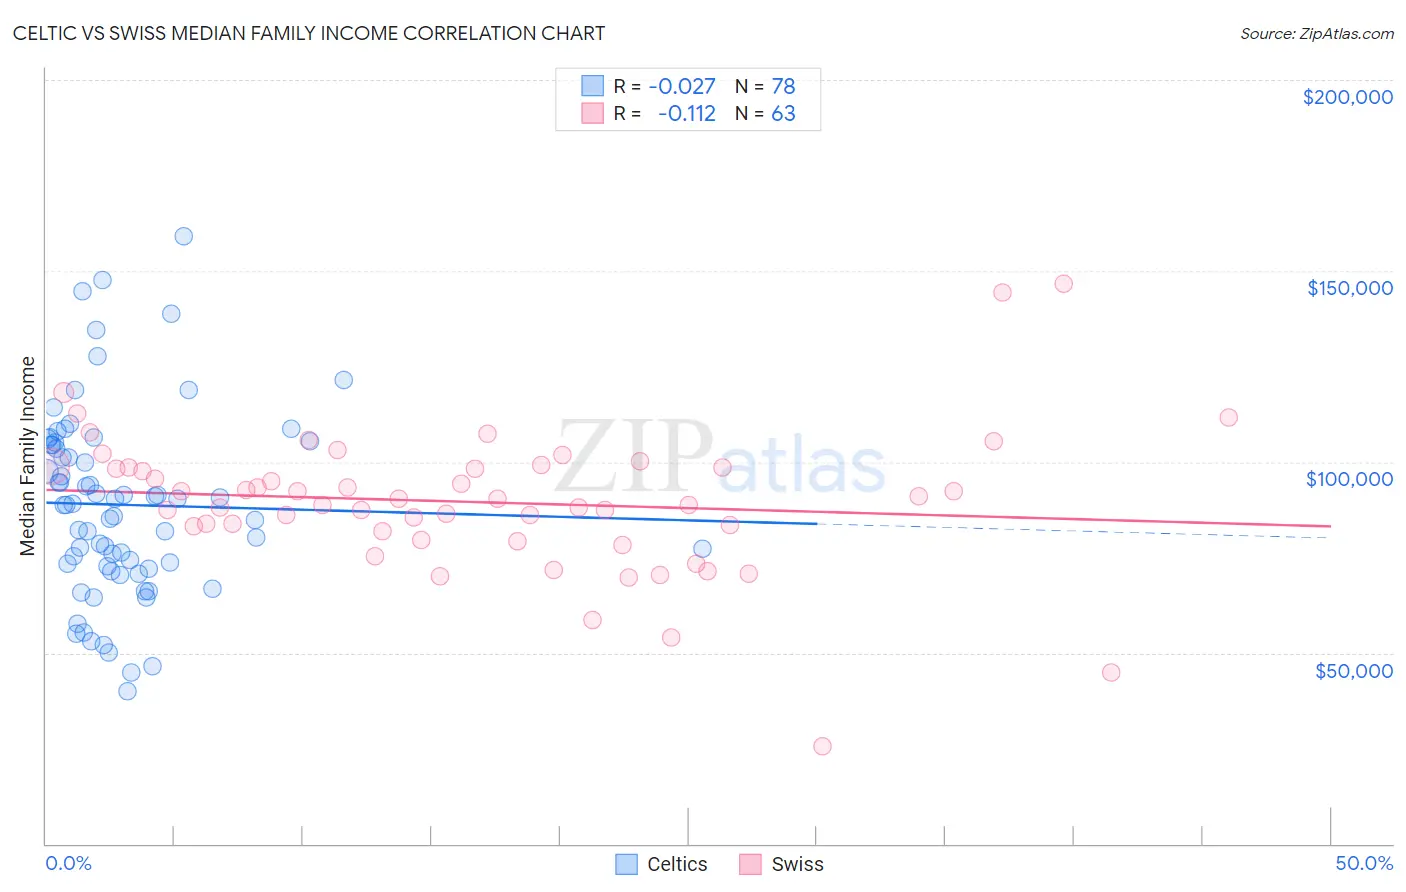
Celtic vs Swiss Median Family Income Correlation Chart
The statistical analysis conducted on geographies consisting of 168,835,112 people shows no correlation between the proportion of Celtics and median family income in the United States with a correlation coefficient (R) of -0.027 and weighted average of $101,139. Similarly, the statistical analysis conducted on geographies consisting of 464,558,670 people shows a poor negative correlation between the proportion of Swiss and median family income in the United States with a correlation coefficient (R) of -0.112 and weighted average of $104,396, a difference of 3.2%.
Median Family Income Correlation Summary
| Measurement | Celtic | Swiss |
| Minimum | $39,850 | $25,401 |
| Maximum | $159,107 | $146,603 |
| Range | $119,257 | $121,202 |
| Mean | $88,779 | $89,459 |
| Median | $88,800 | $90,414 |
| Interquartile 25% (IQ1) | $72,704 | $81,791 |
| Interquartile 75% (IQ3) | $104,459 | $98,522 |
| Interquartile Range (IQR) | $31,755 | $16,731 |
| Standard Deviation (Sample) | $24,372 | $18,875 |
| Standard Deviation (Population) | $24,216 | $18,724 |
Similar Demographics by Median Family Income
Demographics Similar to Celtics by Median Family Income
In terms of median family income, the demographic groups most similar to Celtics are Dutch ($101,192, a difference of 0.050%), Tlingit-Haida ($101,092, a difference of 0.050%), Guamanian/Chamorro ($101,061, a difference of 0.080%), Immigrants from Portugal ($100,984, a difference of 0.15%), and Immigrants ($100,962, a difference of 0.18%).
| Demographics | Rating | Rank | Median Family Income |
| South Americans | 39.7 /100 | #179 | Fair $101,856 |
| French Canadians | 37.0 /100 | #180 | Fair $101,634 |
| Spaniards | 36.8 /100 | #181 | Fair $101,617 |
| Tsimshian | 35.9 /100 | #182 | Fair $101,543 |
| Kenyans | 34.5 /100 | #183 | Fair $101,417 |
| Immigrants | Costa Rica | 33.7 /100 | #184 | Fair $101,354 |
| Dutch | 31.9 /100 | #185 | Fair $101,192 |
| Celtics | 31.3 /100 | #186 | Fair $101,139 |
| Tlingit-Haida | 30.8 /100 | #187 | Fair $101,092 |
| Guamanians/Chamorros | 30.5 /100 | #188 | Fair $101,061 |
| Immigrants | Portugal | 29.6 /100 | #189 | Fair $100,984 |
| Immigrants | Immigrants | 29.4 /100 | #190 | Fair $100,962 |
| Colombians | 27.2 /100 | #191 | Fair $100,750 |
| Immigrants | Kenya | 26.5 /100 | #192 | Fair $100,679 |
| Iraqis | 26.3 /100 | #193 | Fair $100,658 |
Demographics Similar to Swiss by Median Family Income
In terms of median family income, the demographic groups most similar to Swiss are Scandinavian ($104,410, a difference of 0.010%), Moroccan ($104,488, a difference of 0.090%), Scottish ($104,288, a difference of 0.10%), Icelander ($104,282, a difference of 0.11%), and Basque ($104,760, a difference of 0.35%).
| Demographics | Rating | Rank | Median Family Income |
| Immigrants | Albania | 79.1 /100 | #152 | Good $105,285 |
| Slavs | 77.9 /100 | #153 | Good $105,144 |
| Immigrants | Nepal | 76.3 /100 | #154 | Good $104,966 |
| Native Hawaiians | 75.8 /100 | #155 | Good $104,910 |
| Basques | 74.4 /100 | #156 | Good $104,760 |
| Moroccans | 71.6 /100 | #157 | Good $104,488 |
| Scandinavians | 70.8 /100 | #158 | Good $104,410 |
| Swiss | 70.7 /100 | #159 | Good $104,396 |
| Scottish | 69.5 /100 | #160 | Good $104,288 |
| Icelanders | 69.4 /100 | #161 | Good $104,282 |
| Immigrants | Sierra Leone | 66.2 /100 | #162 | Good $103,990 |
| Costa Ricans | 66.2 /100 | #163 | Good $103,989 |
| Sierra Leoneans | 64.7 /100 | #164 | Good $103,859 |
| Slovaks | 63.1 /100 | #165 | Good $103,729 |
| English | 62.6 /100 | #166 | Good $103,684 |