Carpatho Rusyn vs Swiss Median Earnings
COMPARE
Carpatho Rusyn
Swiss
Median Earnings
Median Earnings Comparison
Carpatho Rusyns
Swiss
$48,617
MEDIAN EARNINGS
95.5/ 100
METRIC RATING
120th/ 347
METRIC RANK
$46,315
MEDIAN EARNINGS
45.9/ 100
METRIC RATING
182nd/ 347
METRIC RANK
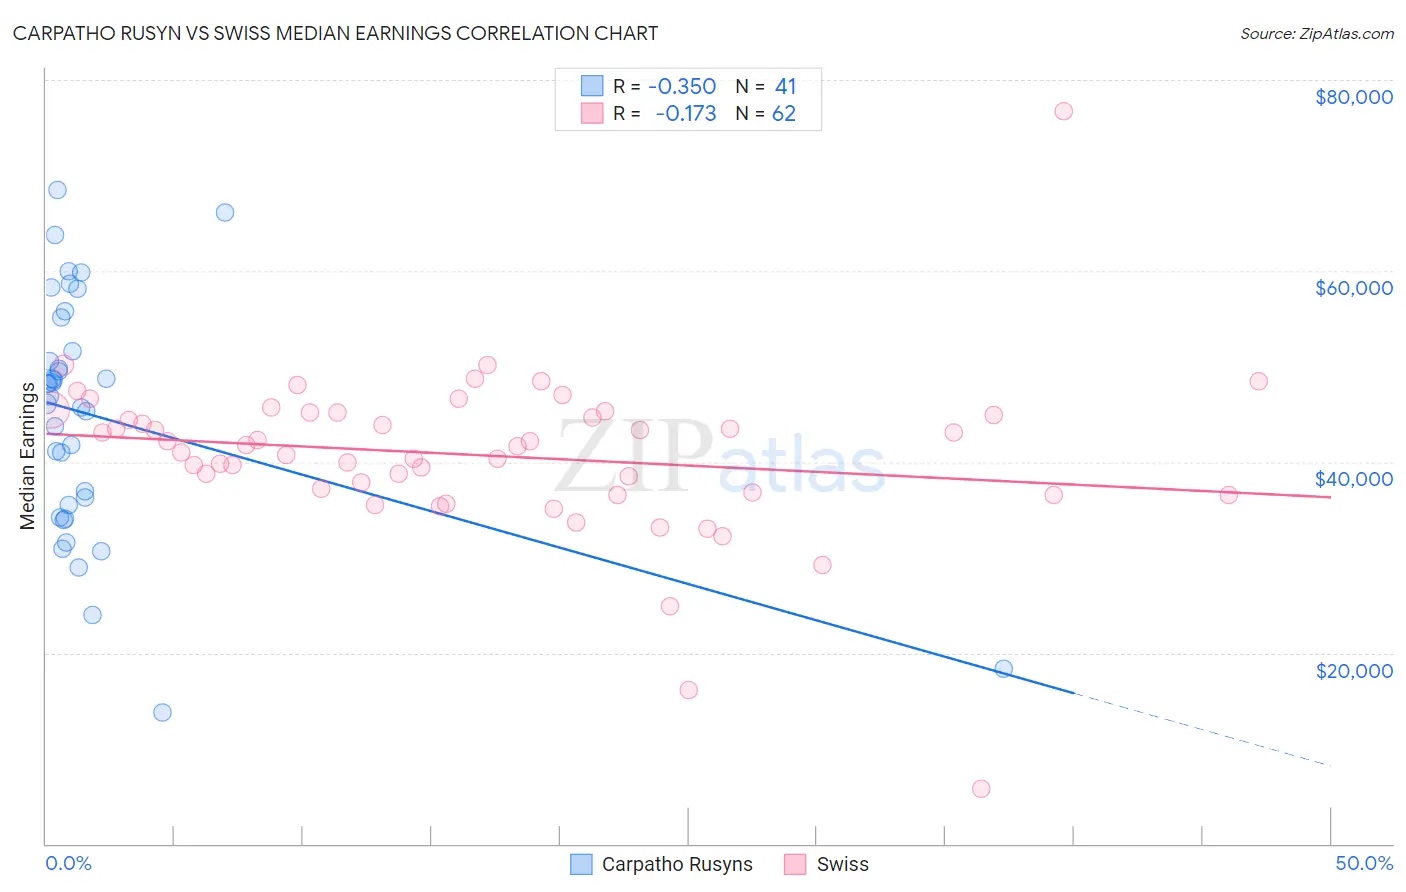
Carpatho Rusyn vs Swiss Median Earnings Correlation Chart
The statistical analysis conducted on geographies consisting of 58,866,831 people shows a mild negative correlation between the proportion of Carpatho Rusyns and median earnings in the United States with a correlation coefficient (R) of -0.350 and weighted average of $48,617. Similarly, the statistical analysis conducted on geographies consisting of 464,919,245 people shows a poor negative correlation between the proportion of Swiss and median earnings in the United States with a correlation coefficient (R) of -0.173 and weighted average of $46,315, a difference of 5.0%.
Median Earnings Correlation Summary
| Measurement | Carpatho Rusyn | Swiss |
| Minimum | $13,750 | $5,729 |
| Maximum | $68,541 | $76,771 |
| Range | $54,791 | $71,042 |
| Mean | $44,793 | $40,710 |
| Median | $46,820 | $41,698 |
| Interquartile 25% (IQ1) | $34,839 | $36,797 |
| Interquartile 75% (IQ3) | $53,317 | $45,132 |
| Interquartile Range (IQR) | $18,479 | $8,335 |
| Standard Deviation (Sample) | $12,606 | $8,837 |
| Standard Deviation (Population) | $12,452 | $8,765 |
Similar Demographics by Median Earnings
Demographics Similar to Carpatho Rusyns by Median Earnings
In terms of median earnings, the demographic groups most similar to Carpatho Rusyns are Arab ($48,599, a difference of 0.040%), Polish ($48,659, a difference of 0.080%), Immigrants from Jordan ($48,673, a difference of 0.11%), Serbian ($48,677, a difference of 0.12%), and Korean ($48,727, a difference of 0.23%).
| Demographics | Rating | Rank | Median Earnings |
| Immigrants | Kuwait | 96.8 /100 | #113 | Exceptional $48,861 |
| Moroccans | 96.7 /100 | #114 | Exceptional $48,838 |
| Chinese | 96.7 /100 | #115 | Exceptional $48,836 |
| Koreans | 96.2 /100 | #116 | Exceptional $48,727 |
| Serbians | 95.9 /100 | #117 | Exceptional $48,677 |
| Immigrants | Jordan | 95.9 /100 | #118 | Exceptional $48,673 |
| Poles | 95.8 /100 | #119 | Exceptional $48,659 |
| Carpatho Rusyns | 95.5 /100 | #120 | Exceptional $48,617 |
| Arabs | 95.4 /100 | #121 | Exceptional $48,599 |
| Chileans | 94.8 /100 | #122 | Exceptional $48,504 |
| Immigrants | Syria | 93.9 /100 | #123 | Exceptional $48,375 |
| Brazilians | 93.7 /100 | #124 | Exceptional $48,356 |
| Immigrants | Fiji | 93.3 /100 | #125 | Exceptional $48,305 |
| Assyrians/Chaldeans/Syriacs | 93.3 /100 | #126 | Exceptional $48,304 |
| Sierra Leoneans | 93.1 /100 | #127 | Exceptional $48,286 |
Demographics Similar to Swiss by Median Earnings
In terms of median earnings, the demographic groups most similar to Swiss are Immigrants from Cameroon ($46,329, a difference of 0.030%), English ($46,334, a difference of 0.040%), Puget Sound Salish ($46,333, a difference of 0.040%), French ($46,296, a difference of 0.040%), and Colombian ($46,349, a difference of 0.070%).
| Demographics | Rating | Rank | Median Earnings |
| Basques | 48.8 /100 | #175 | Average $46,399 |
| Danes | 48.6 /100 | #176 | Average $46,392 |
| Belgians | 48.0 /100 | #177 | Average $46,375 |
| Colombians | 47.1 /100 | #178 | Average $46,349 |
| English | 46.5 /100 | #179 | Average $46,334 |
| Puget Sound Salish | 46.5 /100 | #180 | Average $46,333 |
| Immigrants | Cameroon | 46.4 /100 | #181 | Average $46,329 |
| Swiss | 45.9 /100 | #182 | Average $46,315 |
| French | 45.2 /100 | #183 | Average $46,296 |
| Immigrants | Kenya | 42.4 /100 | #184 | Average $46,214 |
| Uruguayans | 41.6 /100 | #185 | Average $46,190 |
| Vietnamese | 40.9 /100 | #186 | Average $46,172 |
| Iraqis | 39.9 /100 | #187 | Fair $46,140 |
| Immigrants | Armenia | 38.3 /100 | #188 | Fair $46,094 |
| Spaniards | 37.2 /100 | #189 | Fair $46,059 |