Carpatho Rusyn vs Immigrants from Western Asia Median Female Earnings
COMPARE
Carpatho Rusyn
Immigrants from Western Asia
Median Female Earnings
Median Female Earnings Comparison
Carpatho Rusyns
Immigrants from Western Asia
$40,825
MEDIAN FEMALE EARNINGS
91.2/ 100
METRIC RATING
128th/ 347
METRIC RANK
$41,375
MEDIAN FEMALE EARNINGS
97.0/ 100
METRIC RATING
110th/ 347
METRIC RANK
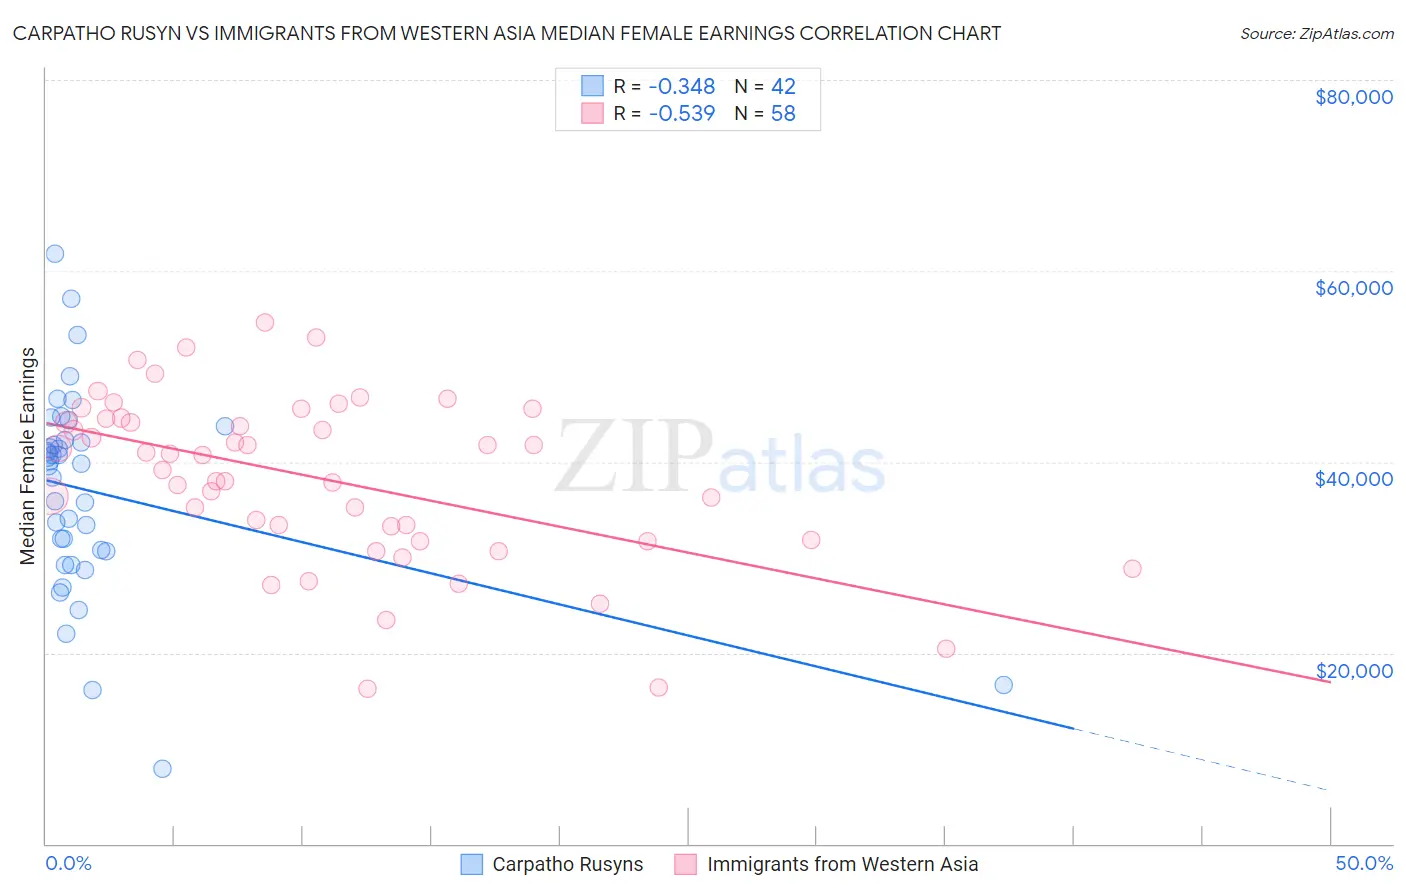
Carpatho Rusyn vs Immigrants from Western Asia Median Female Earnings Correlation Chart
The statistical analysis conducted on geographies consisting of 58,866,706 people shows a mild negative correlation between the proportion of Carpatho Rusyns and median female earnings in the United States with a correlation coefficient (R) of -0.348 and weighted average of $40,825. Similarly, the statistical analysis conducted on geographies consisting of 404,311,505 people shows a substantial negative correlation between the proportion of Immigrants from Western Asia and median female earnings in the United States with a correlation coefficient (R) of -0.539 and weighted average of $41,375, a difference of 1.3%.
Median Female Earnings Correlation Summary
| Measurement | Carpatho Rusyn | Immigrants from Western Asia |
| Minimum | $7,813 | $16,250 |
| Maximum | $61,814 | $54,624 |
| Range | $54,001 | $38,374 |
| Mean | $36,836 | $38,176 |
| Median | $39,667 | $39,928 |
| Interquartile 25% (IQ1) | $30,625 | $31,875 |
| Interquartile 75% (IQ3) | $42,321 | $44,547 |
| Interquartile Range (IQR) | $11,696 | $12,672 |
| Standard Deviation (Sample) | $10,700 | $8,734 |
| Standard Deviation (Population) | $10,572 | $8,658 |
Demographics Similar to Carpatho Rusyns and Immigrants from Western Asia by Median Female Earnings
In terms of median female earnings, the demographic groups most similar to Carpatho Rusyns are Zimbabwean ($40,798, a difference of 0.070%), Ugandan ($40,889, a difference of 0.16%), Immigrants from Trinidad and Tobago ($40,895, a difference of 0.17%), Austrian ($40,923, a difference of 0.24%), and Trinidadian and Tobagonian ($40,958, a difference of 0.33%). Similarly, the demographic groups most similar to Immigrants from Western Asia are Immigrants from Canada ($41,373, a difference of 0.010%), Immigrants from North America ($41,319, a difference of 0.14%), Chinese ($41,461, a difference of 0.21%), Macedonian ($41,286, a difference of 0.22%), and Immigrants from England ($41,277, a difference of 0.24%).
| Demographics | Rating | Rank | Median Female Earnings |
| Chinese | 97.5 /100 | #109 | Exceptional $41,461 |
| Immigrants | Western Asia | 97.0 /100 | #110 | Exceptional $41,375 |
| Immigrants | Canada | 97.0 /100 | #111 | Exceptional $41,373 |
| Immigrants | North America | 96.7 /100 | #112 | Exceptional $41,319 |
| Macedonians | 96.4 /100 | #113 | Exceptional $41,286 |
| Immigrants | England | 96.4 /100 | #114 | Exceptional $41,277 |
| Koreans | 96.4 /100 | #115 | Exceptional $41,276 |
| Immigrants | Brazil | 96.4 /100 | #116 | Exceptional $41,273 |
| Barbadians | 96.3 /100 | #117 | Exceptional $41,261 |
| Immigrants | Lebanon | 95.6 /100 | #118 | Exceptional $41,183 |
| Immigrants | Philippines | 95.0 /100 | #119 | Exceptional $41,114 |
| Immigrants | Kuwait | 94.4 /100 | #120 | Exceptional $41,055 |
| Croatians | 93.7 /100 | #121 | Exceptional $40,993 |
| Immigrants | Jordan | 93.5 /100 | #122 | Exceptional $40,977 |
| Guyanese | 93.4 /100 | #123 | Exceptional $40,973 |
| Trinidadians and Tobagonians | 93.2 /100 | #124 | Exceptional $40,958 |
| Austrians | 92.7 /100 | #125 | Exceptional $40,923 |
| Immigrants | Trinidad and Tobago | 92.3 /100 | #126 | Exceptional $40,895 |
| Ugandans | 92.2 /100 | #127 | Exceptional $40,889 |
| Carpatho Rusyns | 91.2 /100 | #128 | Exceptional $40,825 |
| Zimbabweans | 90.8 /100 | #129 | Exceptional $40,798 |