Cape Verdean vs Immigrants from Western Europe Householder Income Under 25 years
COMPARE
Cape Verdean
Immigrants from Western Europe
Householder Income Under 25 years
Householder Income Under 25 years Comparison
Cape Verdeans
Immigrants from Western Europe
$51,387
HOUSEHOLDER INCOME UNDER 25 YEARS
12.3/ 100
METRIC RATING
205th/ 347
METRIC RANK
$52,957
HOUSEHOLDER INCOME UNDER 25 YEARS
86.7/ 100
METRIC RATING
145th/ 347
METRIC RANK
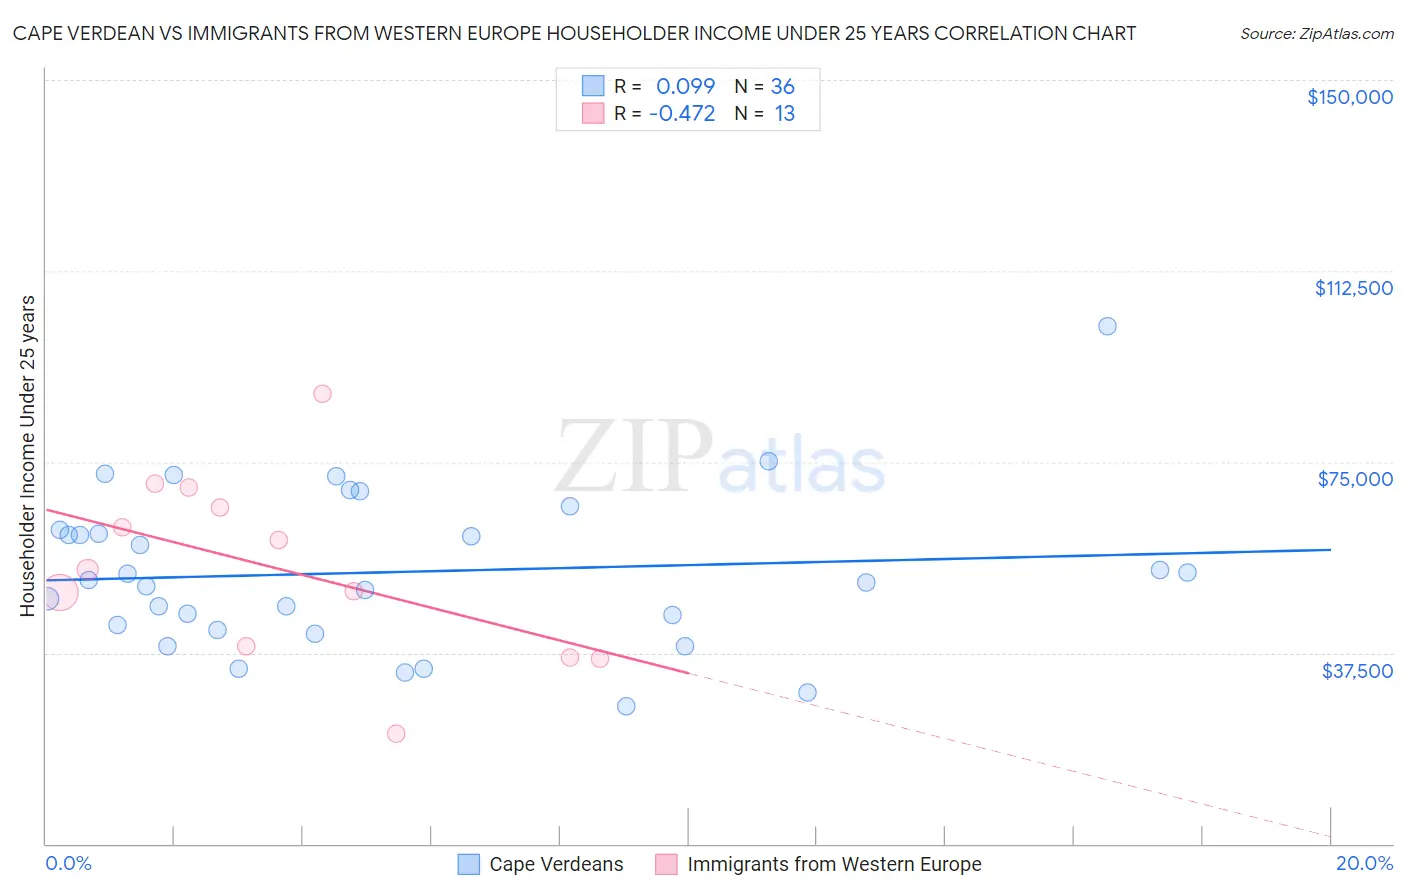
Cape Verdean vs Immigrants from Western Europe Householder Income Under 25 years Correlation Chart
The statistical analysis conducted on geographies consisting of 98,258,749 people shows a slight positive correlation between the proportion of Cape Verdeans and household income with householder under the age of 25 in the United States with a correlation coefficient (R) of 0.099 and weighted average of $51,387. Similarly, the statistical analysis conducted on geographies consisting of 400,852,129 people shows a moderate negative correlation between the proportion of Immigrants from Western Europe and household income with householder under the age of 25 in the United States with a correlation coefficient (R) of -0.472 and weighted average of $52,957, a difference of 3.1%.
Householder Income Under 25 years Correlation Summary
| Measurement | Cape Verdean | Immigrants from Western Europe |
| Minimum | $26,996 | $21,627 |
| Maximum | $101,579 | $88,400 |
| Range | $74,583 | $66,773 |
| Mean | $53,331 | $54,075 |
| Median | $51,533 | $53,818 |
| Interquartile 25% (IQ1) | $42,557 | $37,651 |
| Interquartile 75% (IQ3) | $61,225 | $68,022 |
| Interquartile Range (IQR) | $18,668 | $30,371 |
| Standard Deviation (Sample) | $15,423 | $18,027 |
| Standard Deviation (Population) | $15,208 | $17,320 |
Similar Demographics by Householder Income Under 25 years
Demographics Similar to Cape Verdeans by Householder Income Under 25 years
In terms of householder income under 25 years, the demographic groups most similar to Cape Verdeans are Immigrants from Latin America ($51,387, a difference of 0.0%), South African ($51,383, a difference of 0.010%), Immigrants from Jordan ($51,370, a difference of 0.030%), Czech ($51,421, a difference of 0.070%), and Syrian ($51,353, a difference of 0.070%).
| Demographics | Rating | Rank | Householder Income Under 25 years |
| Immigrants | Syria | 15.4 /100 | #198 | Poor $51,494 |
| Swiss | 15.4 /100 | #199 | Poor $51,493 |
| Immigrants | West Indies | 14.9 /100 | #200 | Poor $51,479 |
| British | 14.9 /100 | #201 | Poor $51,477 |
| Immigrants | Guatemala | 14.0 /100 | #202 | Poor $51,447 |
| Immigrants | Cameroon | 13.6 /100 | #203 | Poor $51,433 |
| Czechs | 13.2 /100 | #204 | Poor $51,421 |
| Cape Verdeans | 12.3 /100 | #205 | Poor $51,387 |
| Immigrants | Latin America | 12.3 /100 | #206 | Poor $51,387 |
| South Africans | 12.2 /100 | #207 | Poor $51,383 |
| Immigrants | Jordan | 11.9 /100 | #208 | Poor $51,370 |
| Syrians | 11.4 /100 | #209 | Poor $51,353 |
| Immigrants | Ghana | 10.9 /100 | #210 | Poor $51,333 |
| Irish | 10.6 /100 | #211 | Poor $51,317 |
| Immigrants | Panama | 9.7 /100 | #212 | Tragic $51,278 |
Demographics Similar to Immigrants from Western Europe by Householder Income Under 25 years
In terms of householder income under 25 years, the demographic groups most similar to Immigrants from Western Europe are South American Indian ($52,979, a difference of 0.040%), Immigrants from Armenia ($52,986, a difference of 0.050%), Swedish ($52,986, a difference of 0.050%), Danish ($53,041, a difference of 0.16%), and Hawaiian ($53,078, a difference of 0.23%).
| Demographics | Rating | Rank | Householder Income Under 25 years |
| Norwegians | 90.8 /100 | #138 | Exceptional $53,127 |
| Costa Ricans | 90.4 /100 | #139 | Exceptional $53,106 |
| Hawaiians | 89.8 /100 | #140 | Excellent $53,078 |
| Danes | 88.9 /100 | #141 | Excellent $53,041 |
| Immigrants | Armenia | 87.5 /100 | #142 | Excellent $52,986 |
| Swedes | 87.5 /100 | #143 | Excellent $52,986 |
| South American Indians | 87.3 /100 | #144 | Excellent $52,979 |
| Immigrants | Western Europe | 86.7 /100 | #145 | Excellent $52,957 |
| Immigrants | Hungary | 81.6 /100 | #146 | Excellent $52,798 |
| Latvians | 81.0 /100 | #147 | Excellent $52,783 |
| French Canadians | 76.5 /100 | #148 | Good $52,672 |
| Scandinavians | 75.7 /100 | #149 | Good $52,654 |
| Immigrants | Costa Rica | 75.2 /100 | #150 | Good $52,643 |
| Immigrants | Scotland | 75.0 /100 | #151 | Good $52,638 |
| Trinidadians and Tobagonians | 74.6 /100 | #152 | Good $52,631 |