Cape Verdean vs Immigrants from Jamaica Median Family Income
COMPARE
Cape Verdean
Immigrants from Jamaica
Median Family Income
Median Family Income Comparison
Cape Verdeans
Immigrants from Jamaica
$91,848
MEDIAN FAMILY INCOME
0.4/ 100
METRIC RATING
259th/ 347
METRIC RANK
$89,268
MEDIAN FAMILY INCOME
0.1/ 100
METRIC RATING
277th/ 347
METRIC RANK
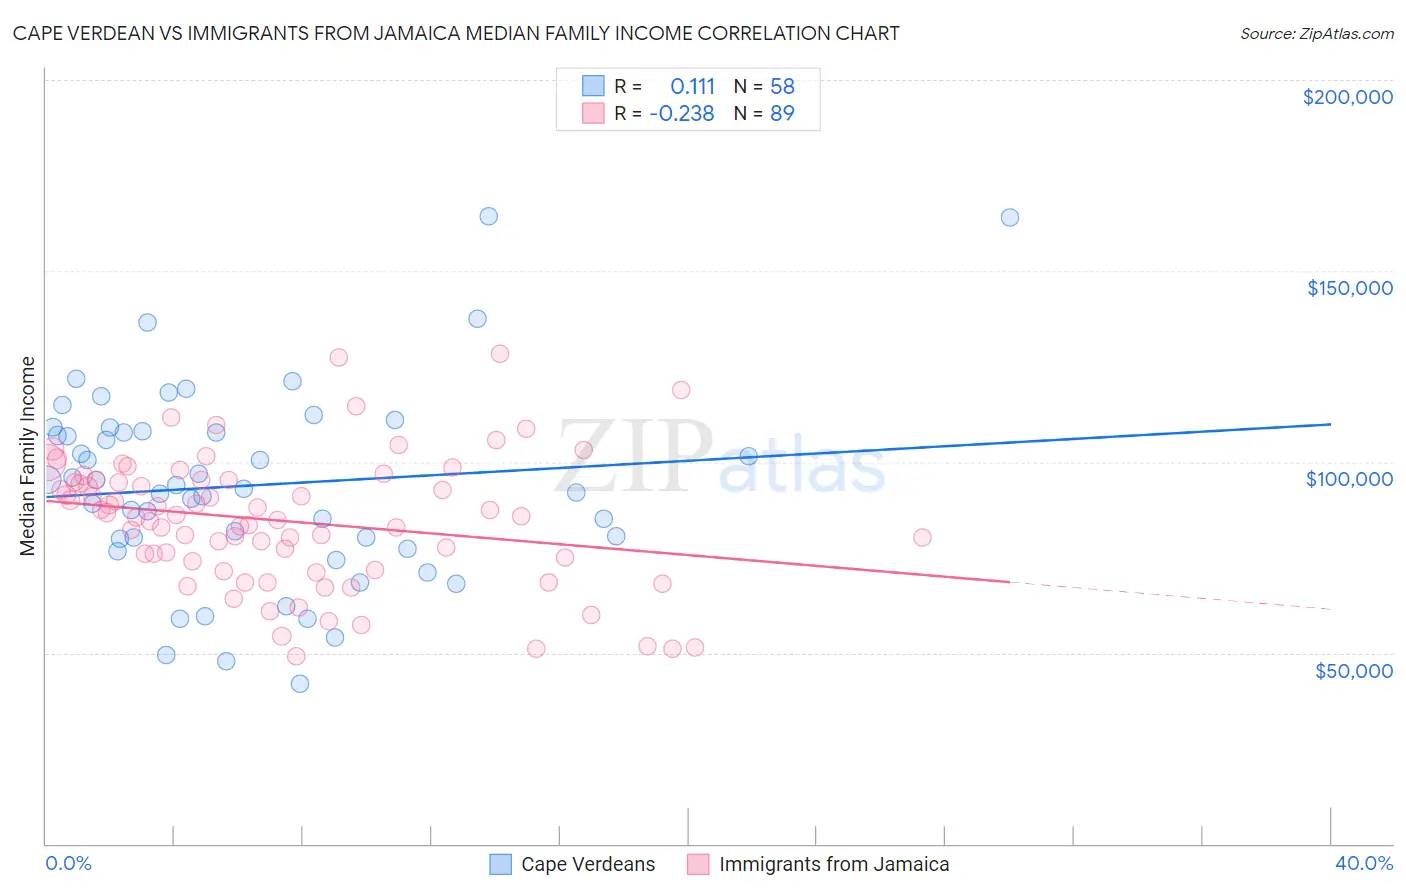
Cape Verdean vs Immigrants from Jamaica Median Family Income Correlation Chart
The statistical analysis conducted on geographies consisting of 107,530,088 people shows a poor positive correlation between the proportion of Cape Verdeans and median family income in the United States with a correlation coefficient (R) of 0.111 and weighted average of $91,848. Similarly, the statistical analysis conducted on geographies consisting of 301,510,584 people shows a weak negative correlation between the proportion of Immigrants from Jamaica and median family income in the United States with a correlation coefficient (R) of -0.238 and weighted average of $89,268, a difference of 2.9%.
Median Family Income Correlation Summary
| Measurement | Cape Verdean | Immigrants from Jamaica |
| Minimum | $41,875 | $49,200 |
| Maximum | $164,351 | $128,421 |
| Range | $122,476 | $79,221 |
| Mean | $93,845 | $84,512 |
| Median | $93,404 | $85,741 |
| Interquartile 25% (IQ1) | $79,783 | $72,845 |
| Interquartile 75% (IQ3) | $107,913 | $95,144 |
| Interquartile Range (IQR) | $28,129 | $22,299 |
| Standard Deviation (Sample) | $25,352 | $17,087 |
| Standard Deviation (Population) | $25,133 | $16,991 |
Demographics Similar to Cape Verdeans and Immigrants from Jamaica by Median Family Income
In terms of median family income, the demographic groups most similar to Cape Verdeans are Osage ($91,926, a difference of 0.090%), Pennsylvania German ($91,763, a difference of 0.090%), Inupiat ($91,730, a difference of 0.13%), Liberian ($91,722, a difference of 0.14%), and Immigrants from West Indies ($91,588, a difference of 0.28%). Similarly, the demographic groups most similar to Immigrants from Jamaica are Immigrants from Zaire ($89,285, a difference of 0.020%), Immigrants from Grenada ($89,249, a difference of 0.020%), Immigrants from St. Vincent and the Grenadines ($90,094, a difference of 0.93%), Spanish American ($90,322, a difference of 1.2%), and Immigrants from Micronesia ($90,345, a difference of 1.2%).
| Demographics | Rating | Rank | Median Family Income |
| Osage | 0.4 /100 | #258 | Tragic $91,926 |
| Cape Verdeans | 0.4 /100 | #259 | Tragic $91,848 |
| Pennsylvania Germans | 0.4 /100 | #260 | Tragic $91,763 |
| Inupiat | 0.4 /100 | #261 | Tragic $91,730 |
| Liberians | 0.4 /100 | #262 | Tragic $91,722 |
| Immigrants | West Indies | 0.3 /100 | #263 | Tragic $91,588 |
| Senegalese | 0.3 /100 | #264 | Tragic $91,475 |
| Hmong | 0.3 /100 | #265 | Tragic $91,296 |
| Central Americans | 0.3 /100 | #266 | Tragic $91,087 |
| Mexican American Indians | 0.2 /100 | #267 | Tragic $90,918 |
| Cree | 0.2 /100 | #268 | Tragic $90,882 |
| Belizeans | 0.2 /100 | #269 | Tragic $90,880 |
| Jamaicans | 0.2 /100 | #270 | Tragic $90,581 |
| Iroquois | 0.2 /100 | #271 | Tragic $90,543 |
| Immigrants | Liberia | 0.2 /100 | #272 | Tragic $90,450 |
| Immigrants | Micronesia | 0.2 /100 | #273 | Tragic $90,345 |
| Spanish Americans | 0.2 /100 | #274 | Tragic $90,322 |
| Immigrants | St. Vincent and the Grenadines | 0.2 /100 | #275 | Tragic $90,094 |
| Immigrants | Zaire | 0.1 /100 | #276 | Tragic $89,285 |
| Immigrants | Jamaica | 0.1 /100 | #277 | Tragic $89,268 |
| Immigrants | Grenada | 0.1 /100 | #278 | Tragic $89,249 |