Cape Verdean vs Immigrants from Eastern Asia Median Female Earnings
COMPARE
Cape Verdean
Immigrants from Eastern Asia
Median Female Earnings
Median Female Earnings Comparison
Cape Verdeans
Immigrants from Eastern Asia
$38,614
MEDIAN FEMALE EARNINGS
9.5/ 100
METRIC RATING
218th/ 347
METRIC RANK
$46,502
MEDIAN FEMALE EARNINGS
100.0/ 100
METRIC RATING
15th/ 347
METRIC RANK
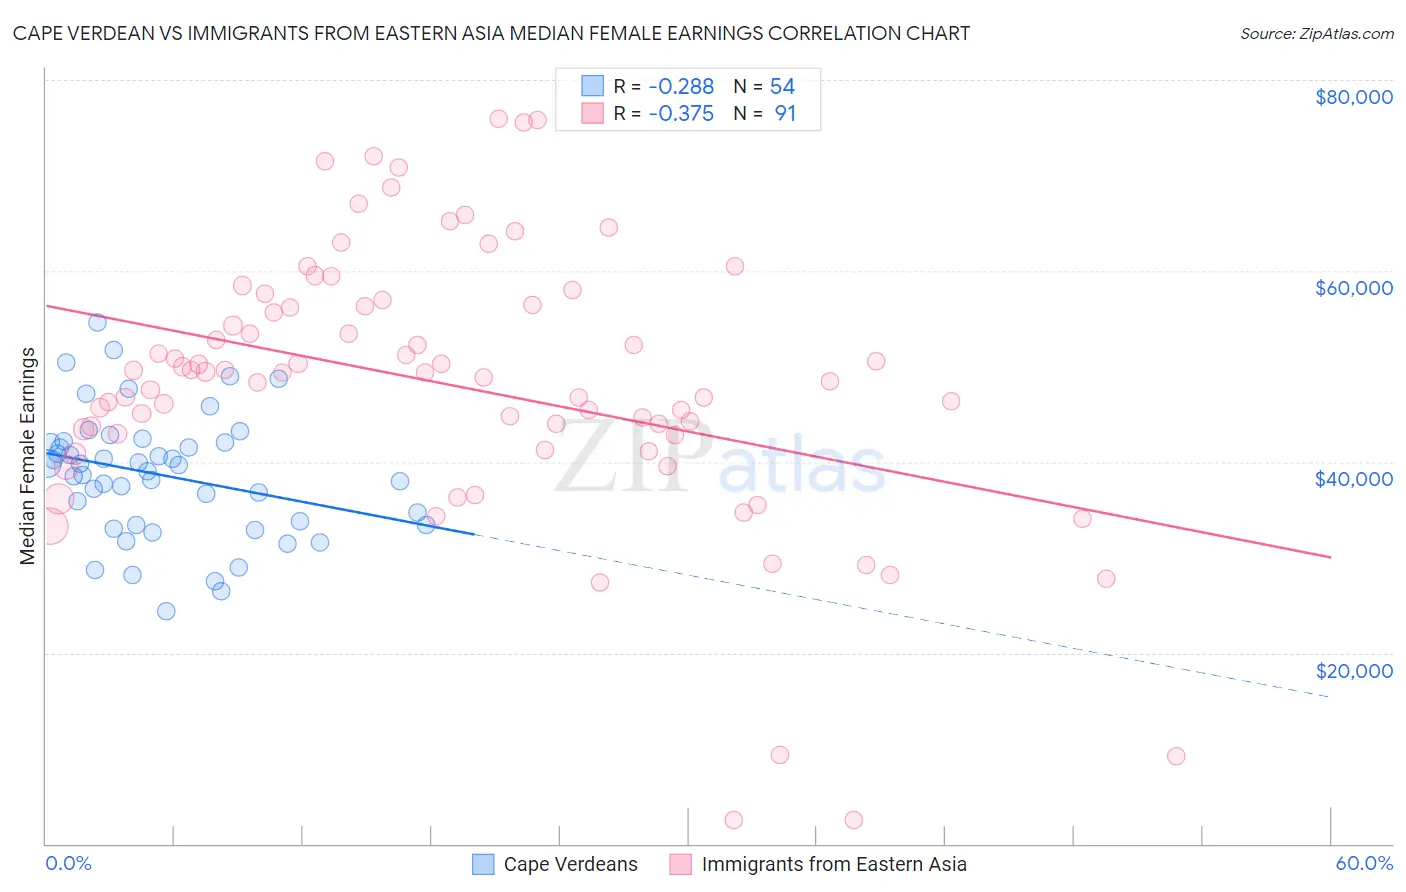
Cape Verdean vs Immigrants from Eastern Asia Median Female Earnings Correlation Chart
The statistical analysis conducted on geographies consisting of 107,559,338 people shows a weak negative correlation between the proportion of Cape Verdeans and median female earnings in the United States with a correlation coefficient (R) of -0.288 and weighted average of $38,614. Similarly, the statistical analysis conducted on geographies consisting of 499,525,371 people shows a mild negative correlation between the proportion of Immigrants from Eastern Asia and median female earnings in the United States with a correlation coefficient (R) of -0.375 and weighted average of $46,502, a difference of 20.4%.
Median Female Earnings Correlation Summary
| Measurement | Cape Verdean | Immigrants from Eastern Asia |
| Minimum | $24,340 | $2,499 |
| Maximum | $54,554 | $75,958 |
| Range | $30,214 | $73,459 |
| Mean | $38,613 | $48,076 |
| Median | $39,359 | $49,327 |
| Interquartile 25% (IQ1) | $33,431 | $42,770 |
| Interquartile 75% (IQ3) | $42,075 | $56,452 |
| Interquartile Range (IQR) | $8,644 | $13,682 |
| Standard Deviation (Sample) | $6,549 | $14,424 |
| Standard Deviation (Population) | $6,488 | $14,344 |
Similar Demographics by Median Female Earnings
Demographics Similar to Cape Verdeans by Median Female Earnings
In terms of median female earnings, the demographic groups most similar to Cape Verdeans are Immigrants from Jamaica ($38,625, a difference of 0.030%), Nepalese ($38,603, a difference of 0.030%), Immigrants from Ecuador ($38,644, a difference of 0.080%), Spaniard ($38,656, a difference of 0.11%), and Yugoslavian ($38,573, a difference of 0.11%).
| Demographics | Rating | Rank | Median Female Earnings |
| Aleuts | 11.6 /100 | #211 | Poor $38,719 |
| Guamanians/Chamorros | 11.5 /100 | #212 | Poor $38,717 |
| Jamaicans | 10.5 /100 | #213 | Poor $38,670 |
| Iraqis | 10.5 /100 | #214 | Poor $38,666 |
| Spaniards | 10.3 /100 | #215 | Poor $38,656 |
| Immigrants | Ecuador | 10.1 /100 | #216 | Poor $38,644 |
| Immigrants | Jamaica | 9.7 /100 | #217 | Tragic $38,625 |
| Cape Verdeans | 9.5 /100 | #218 | Tragic $38,614 |
| Nepalese | 9.3 /100 | #219 | Tragic $38,603 |
| Yugoslavians | 8.8 /100 | #220 | Tragic $38,573 |
| Immigrants | Azores | 8.8 /100 | #221 | Tragic $38,573 |
| Japanese | 8.1 /100 | #222 | Tragic $38,528 |
| Immigrants | Sudan | 7.8 /100 | #223 | Tragic $38,511 |
| Native Hawaiians | 7.1 /100 | #224 | Tragic $38,461 |
| French | 7.0 /100 | #225 | Tragic $38,457 |
Demographics Similar to Immigrants from Eastern Asia by Median Female Earnings
In terms of median female earnings, the demographic groups most similar to Immigrants from Eastern Asia are Indian (Asian) ($46,481, a difference of 0.050%), Soviet Union ($46,556, a difference of 0.11%), Immigrants from Australia ($46,573, a difference of 0.15%), Immigrants from South Central Asia ($46,324, a difference of 0.39%), and Immigrants from Israel ($46,902, a difference of 0.86%).
| Demographics | Rating | Rank | Median Female Earnings |
| Iranians | 100.0 /100 | #8 | Exceptional $47,421 |
| Immigrants | Iran | 100.0 /100 | #9 | Exceptional $47,154 |
| Immigrants | China | 100.0 /100 | #10 | Exceptional $46,972 |
| Okinawans | 100.0 /100 | #11 | Exceptional $46,905 |
| Immigrants | Israel | 100.0 /100 | #12 | Exceptional $46,902 |
| Immigrants | Australia | 100.0 /100 | #13 | Exceptional $46,573 |
| Soviet Union | 100.0 /100 | #14 | Exceptional $46,556 |
| Immigrants | Eastern Asia | 100.0 /100 | #15 | Exceptional $46,502 |
| Indians (Asian) | 100.0 /100 | #16 | Exceptional $46,481 |
| Immigrants | South Central Asia | 100.0 /100 | #17 | Exceptional $46,324 |
| Cypriots | 100.0 /100 | #18 | Exceptional $45,570 |
| Eastern Europeans | 100.0 /100 | #19 | Exceptional $45,385 |
| Immigrants | Japan | 100.0 /100 | #20 | Exceptional $45,323 |
| Cambodians | 100.0 /100 | #21 | Exceptional $45,014 |
| Immigrants | Greece | 100.0 /100 | #22 | Exceptional $44,976 |