Canadian vs Blackfeet Median Earnings
COMPARE
Canadian
Blackfeet
Median Earnings
Median Earnings Comparison
Canadians
Blackfeet
$47,911
MEDIAN EARNINGS
88.8/ 100
METRIC RATING
139th/ 347
METRIC RANK
$41,822
MEDIAN EARNINGS
0.2/ 100
METRIC RATING
284th/ 347
METRIC RANK
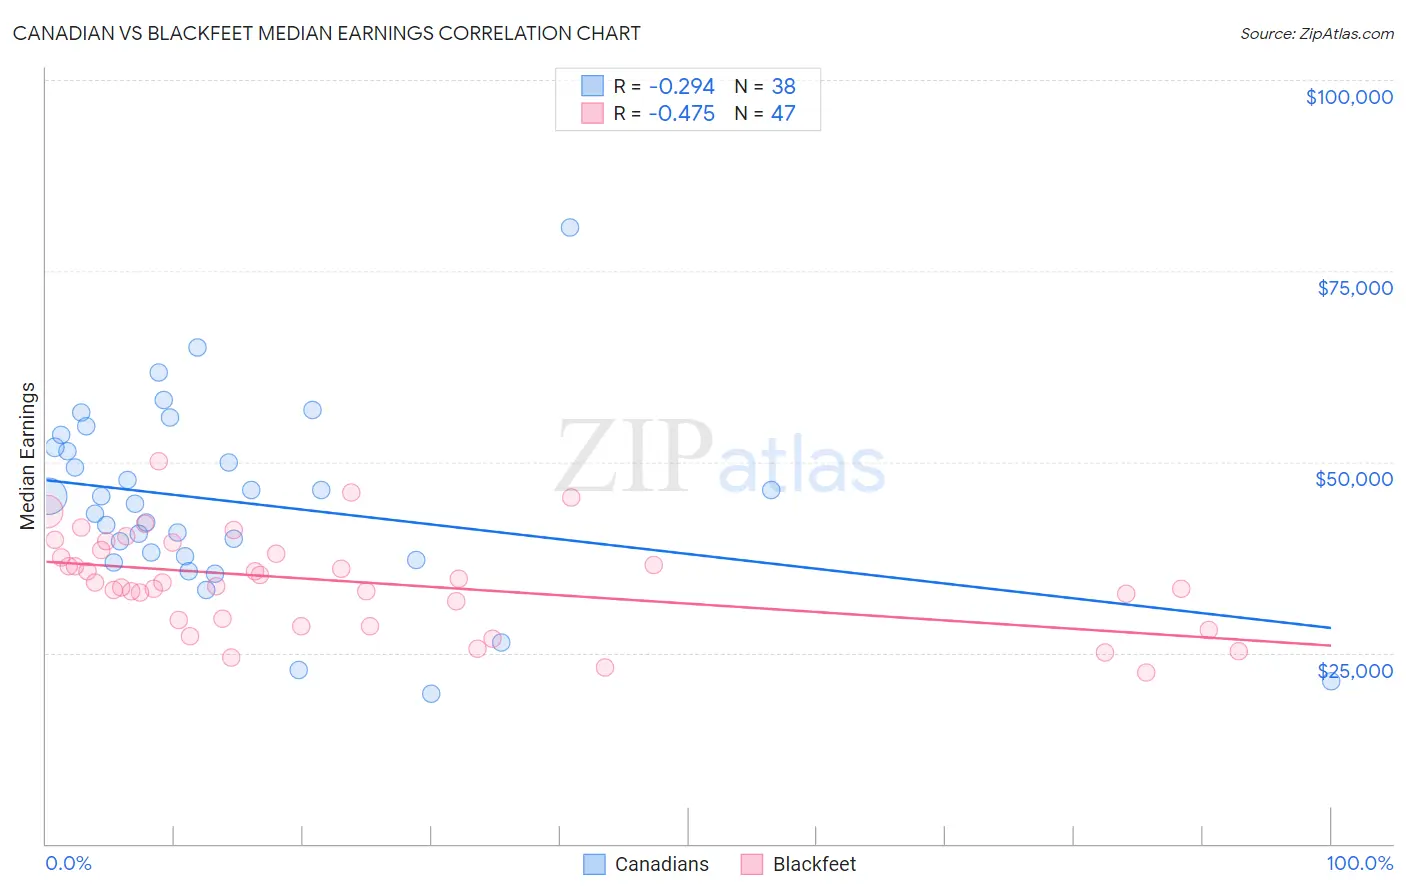
Canadian vs Blackfeet Median Earnings Correlation Chart
The statistical analysis conducted on geographies consisting of 437,494,547 people shows a weak negative correlation between the proportion of Canadians and median earnings in the United States with a correlation coefficient (R) of -0.294 and weighted average of $47,911. Similarly, the statistical analysis conducted on geographies consisting of 309,547,569 people shows a moderate negative correlation between the proportion of Blackfeet and median earnings in the United States with a correlation coefficient (R) of -0.475 and weighted average of $41,822, a difference of 14.6%.
Median Earnings Correlation Summary
| Measurement | Canadian | Blackfeet |
| Minimum | $19,688 | $22,344 |
| Maximum | $80,682 | $50,156 |
| Range | $60,994 | $27,812 |
| Mean | $44,712 | $34,283 |
| Median | $44,948 | $34,137 |
| Interquartile 25% (IQ1) | $37,642 | $29,375 |
| Interquartile 75% (IQ3) | $51,935 | $38,433 |
| Interquartile Range (IQR) | $14,293 | $9,058 |
| Standard Deviation (Sample) | $12,220 | $6,292 |
| Standard Deviation (Population) | $12,058 | $6,225 |
Similar Demographics by Median Earnings
Demographics Similar to Canadians by Median Earnings
In terms of median earnings, the demographic groups most similar to Canadians are European ($47,915, a difference of 0.010%), Taiwanese ($47,902, a difference of 0.020%), Immigrants from Nepal ($47,925, a difference of 0.030%), Immigrants from Sierra Leone ($47,875, a difference of 0.080%), and Ugandan ($47,854, a difference of 0.12%).
| Demographics | Rating | Rank | Median Earnings |
| British | 92.2 /100 | #132 | Exceptional $48,189 |
| Immigrants | Uganda | 90.5 /100 | #133 | Exceptional $48,041 |
| Sri Lankans | 90.5 /100 | #134 | Exceptional $48,040 |
| Portuguese | 90.4 /100 | #135 | Exceptional $48,032 |
| Slovenes | 90.0 /100 | #136 | Excellent $47,995 |
| Immigrants | Nepal | 89.0 /100 | #137 | Excellent $47,925 |
| Europeans | 88.9 /100 | #138 | Excellent $47,915 |
| Canadians | 88.8 /100 | #139 | Excellent $47,911 |
| Taiwanese | 88.7 /100 | #140 | Excellent $47,902 |
| Immigrants | Sierra Leone | 88.3 /100 | #141 | Excellent $47,875 |
| Ugandans | 88.0 /100 | #142 | Excellent $47,854 |
| Swedes | 88.0 /100 | #143 | Excellent $47,851 |
| Hungarians | 87.1 /100 | #144 | Excellent $47,795 |
| Immigrants | Saudi Arabia | 85.6 /100 | #145 | Excellent $47,704 |
| Immigrants | Chile | 85.5 /100 | #146 | Excellent $47,697 |
Demographics Similar to Blackfeet by Median Earnings
In terms of median earnings, the demographic groups most similar to Blackfeet are Dominican ($41,864, a difference of 0.10%), Immigrants from Nicaragua ($41,737, a difference of 0.20%), Mexican American Indian ($41,719, a difference of 0.25%), Indonesian ($41,701, a difference of 0.29%), and African ($41,955, a difference of 0.32%).
| Demographics | Rating | Rank | Median Earnings |
| Central Americans | 0.3 /100 | #277 | Tragic $42,280 |
| Cajuns | 0.3 /100 | #278 | Tragic $42,189 |
| Colville | 0.2 /100 | #279 | Tragic $42,151 |
| Hmong | 0.2 /100 | #280 | Tragic $42,111 |
| Marshallese | 0.2 /100 | #281 | Tragic $41,969 |
| Africans | 0.2 /100 | #282 | Tragic $41,955 |
| Dominicans | 0.2 /100 | #283 | Tragic $41,864 |
| Blackfeet | 0.2 /100 | #284 | Tragic $41,822 |
| Immigrants | Nicaragua | 0.1 /100 | #285 | Tragic $41,737 |
| Mexican American Indians | 0.1 /100 | #286 | Tragic $41,719 |
| Indonesians | 0.1 /100 | #287 | Tragic $41,701 |
| Immigrants | Dominican Republic | 0.1 /100 | #288 | Tragic $41,554 |
| Comanche | 0.1 /100 | #289 | Tragic $41,519 |
| Paiute | 0.1 /100 | #290 | Tragic $41,508 |
| Central American Indians | 0.1 /100 | #291 | Tragic $41,474 |