Cajun vs Immigrants from Middle Africa Householder Income Over 65 years
COMPARE
Cajun
Immigrants from Middle Africa
Householder Income Over 65 years
Householder Income Over 65 years Comparison
Cajuns
Immigrants from Middle Africa
$51,397
HOUSEHOLDER INCOME OVER 65 YEARS
0.0/ 100
METRIC RATING
323rd/ 347
METRIC RANK
$58,375
HOUSEHOLDER INCOME OVER 65 YEARS
6.2/ 100
METRIC RATING
216th/ 347
METRIC RANK
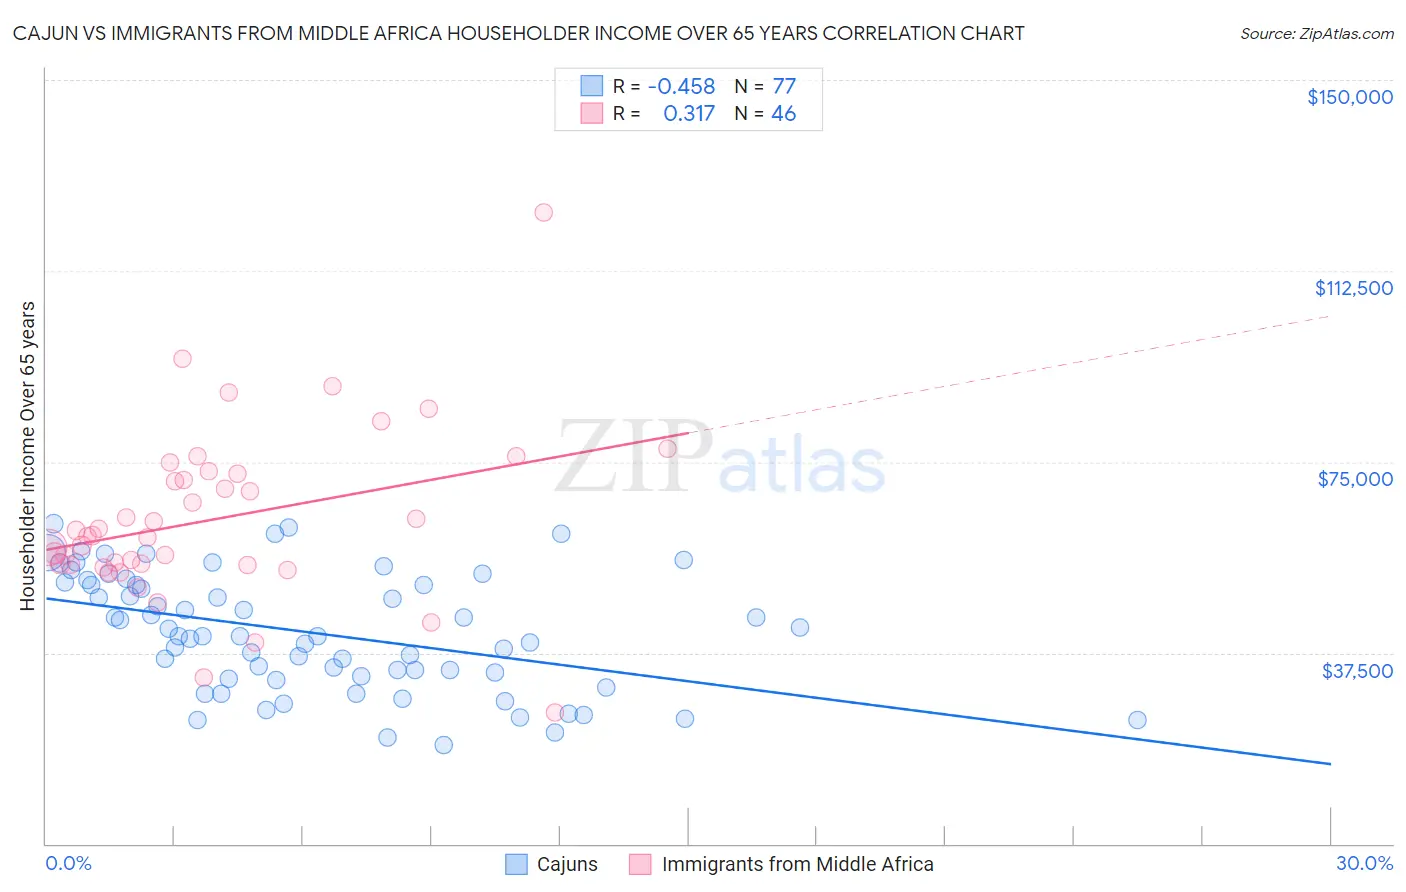
Cajun vs Immigrants from Middle Africa Householder Income Over 65 years Correlation Chart
The statistical analysis conducted on geographies consisting of 149,395,361 people shows a moderate negative correlation between the proportion of Cajuns and household income with householder over the age of 65 in the United States with a correlation coefficient (R) of -0.458 and weighted average of $51,397. Similarly, the statistical analysis conducted on geographies consisting of 202,332,697 people shows a mild positive correlation between the proportion of Immigrants from Middle Africa and household income with householder over the age of 65 in the United States with a correlation coefficient (R) of 0.317 and weighted average of $58,375, a difference of 13.6%.
Householder Income Over 65 years Correlation Summary
| Measurement | Cajun | Immigrants from Middle Africa |
| Minimum | $19,375 | $25,694 |
| Maximum | $62,907 | $123,958 |
| Range | $43,532 | $98,264 |
| Mean | $41,476 | $63,734 |
| Median | $40,796 | $60,422 |
| Interquartile 25% (IQ1) | $32,741 | $54,749 |
| Interquartile 75% (IQ3) | $51,179 | $72,688 |
| Interquartile Range (IQR) | $18,438 | $17,939 |
| Standard Deviation (Sample) | $11,437 | $16,799 |
| Standard Deviation (Population) | $11,362 | $16,615 |
Similar Demographics by Householder Income Over 65 years
Demographics Similar to Cajuns by Householder Income Over 65 years
In terms of householder income over 65 years, the demographic groups most similar to Cajuns are Immigrants from Congo ($51,393, a difference of 0.010%), British West Indian ($51,463, a difference of 0.13%), Immigrants from Haiti ($51,219, a difference of 0.35%), Kiowa ($51,140, a difference of 0.50%), and Menominee ($51,719, a difference of 0.63%).
| Demographics | Rating | Rank | Householder Income Over 65 years |
| Creek | 0.0 /100 | #316 | Tragic $51,949 |
| Immigrants | St. Vincent and the Grenadines | 0.0 /100 | #317 | Tragic $51,922 |
| Haitians | 0.0 /100 | #318 | Tragic $51,912 |
| Immigrants | Honduras | 0.0 /100 | #319 | Tragic $51,888 |
| Colville | 0.0 /100 | #320 | Tragic $51,739 |
| Menominee | 0.0 /100 | #321 | Tragic $51,719 |
| British West Indians | 0.0 /100 | #322 | Tragic $51,463 |
| Cajuns | 0.0 /100 | #323 | Tragic $51,397 |
| Immigrants | Congo | 0.0 /100 | #324 | Tragic $51,393 |
| Immigrants | Haiti | 0.0 /100 | #325 | Tragic $51,219 |
| Kiowa | 0.0 /100 | #326 | Tragic $51,140 |
| Bahamians | 0.0 /100 | #327 | Tragic $51,000 |
| Hopi | 0.0 /100 | #328 | Tragic $50,925 |
| Blacks/African Americans | 0.0 /100 | #329 | Tragic $50,779 |
| Immigrants | Grenada | 0.0 /100 | #330 | Tragic $50,747 |
Demographics Similar to Immigrants from Middle Africa by Householder Income Over 65 years
In terms of householder income over 65 years, the demographic groups most similar to Immigrants from Middle Africa are Sudanese ($58,281, a difference of 0.16%), Panamanian ($58,266, a difference of 0.19%), Malaysian ($58,244, a difference of 0.23%), Yugoslavian ($58,243, a difference of 0.23%), and Immigrants from El Salvador ($58,226, a difference of 0.26%).
| Demographics | Rating | Rank | Householder Income Over 65 years |
| Slovaks | 11.7 /100 | #209 | Poor $59,039 |
| Nigerians | 11.2 /100 | #210 | Poor $58,992 |
| Immigrants | Nigeria | 10.7 /100 | #211 | Poor $58,942 |
| Colombians | 9.8 /100 | #212 | Tragic $58,851 |
| Whites/Caucasians | 9.8 /100 | #213 | Tragic $58,847 |
| Nepalese | 9.0 /100 | #214 | Tragic $58,761 |
| Immigrants | Ghana | 7.9 /100 | #215 | Tragic $58,624 |
| Immigrants | Middle Africa | 6.2 /100 | #216 | Tragic $58,375 |
| Sudanese | 5.7 /100 | #217 | Tragic $58,281 |
| Panamanians | 5.6 /100 | #218 | Tragic $58,266 |
| Malaysians | 5.5 /100 | #219 | Tragic $58,244 |
| Yugoslavians | 5.5 /100 | #220 | Tragic $58,243 |
| Immigrants | El Salvador | 5.4 /100 | #221 | Tragic $58,226 |
| Delaware | 5.3 /100 | #222 | Tragic $58,214 |
| Tsimshian | 5.2 /100 | #223 | Tragic $58,202 |