Cajun vs Immigrants from Laos Per Capita Income
COMPARE
Cajun
Immigrants from Laos
Per Capita Income
Per Capita Income Comparison
Cajuns
Immigrants from Laos
$37,527
PER CAPITA INCOME
0.1/ 100
METRIC RATING
291st/ 347
METRIC RANK
$37,857
PER CAPITA INCOME
0.1/ 100
METRIC RATING
282nd/ 347
METRIC RANK
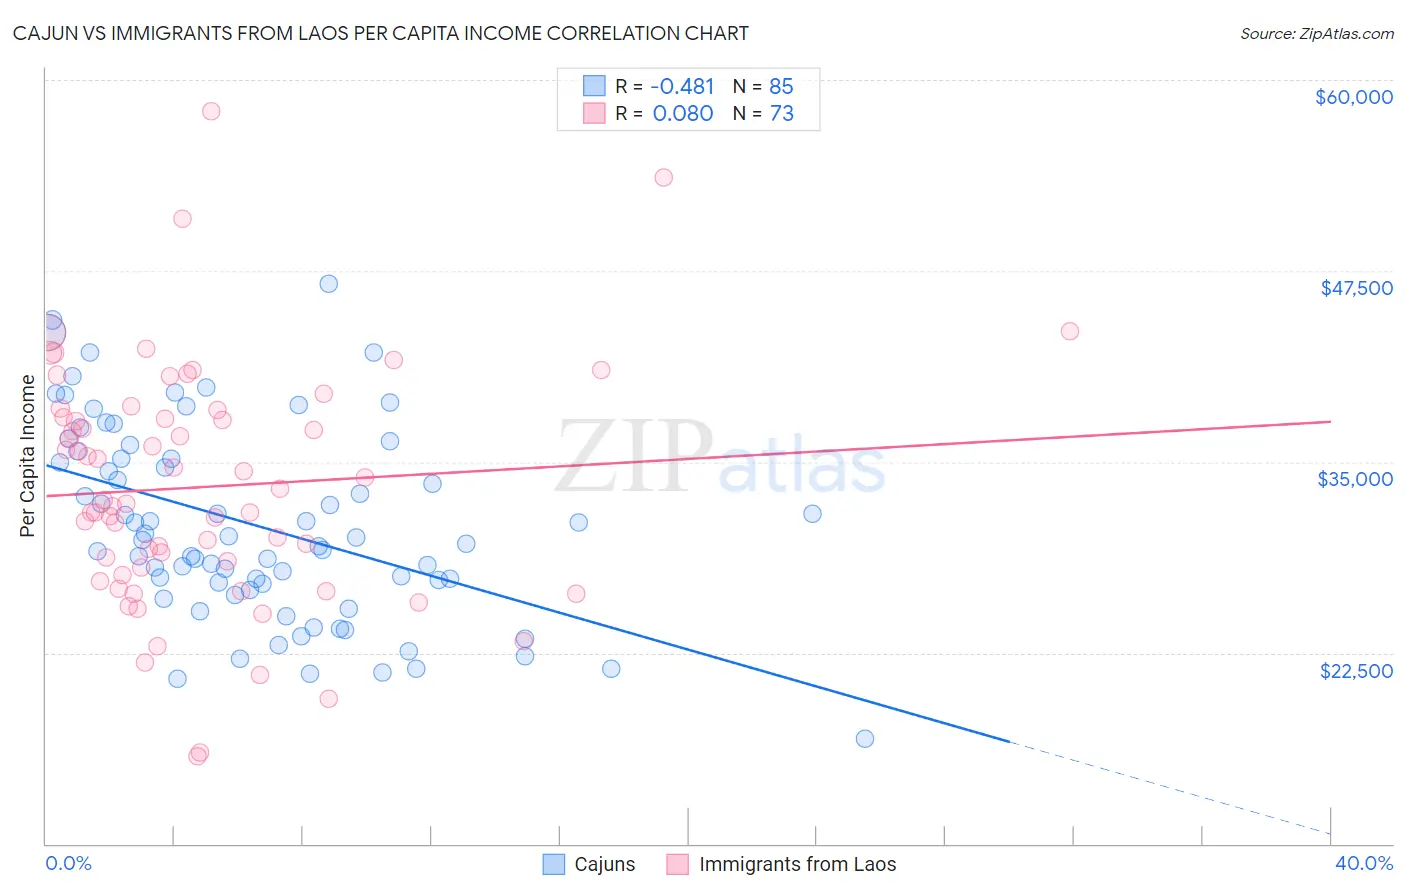
Cajun vs Immigrants from Laos Per Capita Income Correlation Chart
The statistical analysis conducted on geographies consisting of 149,712,942 people shows a moderate negative correlation between the proportion of Cajuns and per capita income in the United States with a correlation coefficient (R) of -0.481 and weighted average of $37,527. Similarly, the statistical analysis conducted on geographies consisting of 201,476,108 people shows a slight positive correlation between the proportion of Immigrants from Laos and per capita income in the United States with a correlation coefficient (R) of 0.080 and weighted average of $37,857, a difference of 0.88%.
Per Capita Income Correlation Summary
| Measurement | Cajun | Immigrants from Laos |
| Minimum | $16,891 | $15,753 |
| Maximum | $46,697 | $57,923 |
| Range | $29,806 | $42,170 |
| Mean | $30,817 | $33,364 |
| Median | $29,870 | $32,473 |
| Interquartile 25% (IQ1) | $26,822 | $27,819 |
| Interquartile 75% (IQ3) | $35,445 | $38,151 |
| Interquartile Range (IQR) | $8,623 | $10,332 |
| Standard Deviation (Sample) | $6,316 | $7,853 |
| Standard Deviation (Population) | $6,279 | $7,799 |
Demographics Similar to Cajuns and Immigrants from Laos by Per Capita Income
In terms of per capita income, the demographic groups most similar to Cajuns are Immigrants from Guatemala ($37,550, a difference of 0.060%), U.S. Virgin Islander ($37,589, a difference of 0.16%), Immigrants from Micronesia ($37,464, a difference of 0.17%), Mexican American Indian ($37,407, a difference of 0.32%), and Cuban ($37,383, a difference of 0.39%). Similarly, the demographic groups most similar to Immigrants from Laos are Pennsylvania German ($37,842, a difference of 0.040%), African ($37,785, a difference of 0.19%), Guatemalan ($37,766, a difference of 0.24%), Immigrants from Dominica ($37,952, a difference of 0.25%), and Central American Indian ($37,699, a difference of 0.42%).
| Demographics | Rating | Rank | Per Capita Income |
| Hmong | 0.2 /100 | #276 | Tragic $38,120 |
| Comanche | 0.2 /100 | #277 | Tragic $38,088 |
| Immigrants | Nicaragua | 0.2 /100 | #278 | Tragic $38,065 |
| Colville | 0.2 /100 | #279 | Tragic $38,047 |
| Potawatomi | 0.2 /100 | #280 | Tragic $38,046 |
| Immigrants | Dominica | 0.2 /100 | #281 | Tragic $37,952 |
| Immigrants | Laos | 0.1 /100 | #282 | Tragic $37,857 |
| Pennsylvania Germans | 0.1 /100 | #283 | Tragic $37,842 |
| Africans | 0.1 /100 | #284 | Tragic $37,785 |
| Guatemalans | 0.1 /100 | #285 | Tragic $37,766 |
| Central American Indians | 0.1 /100 | #286 | Tragic $37,699 |
| Dominicans | 0.1 /100 | #287 | Tragic $37,697 |
| Blackfeet | 0.1 /100 | #288 | Tragic $37,695 |
| U.S. Virgin Islanders | 0.1 /100 | #289 | Tragic $37,589 |
| Immigrants | Guatemala | 0.1 /100 | #290 | Tragic $37,550 |
| Cajuns | 0.1 /100 | #291 | Tragic $37,527 |
| Immigrants | Micronesia | 0.1 /100 | #292 | Tragic $37,464 |
| Mexican American Indians | 0.1 /100 | #293 | Tragic $37,407 |
| Cubans | 0.1 /100 | #294 | Tragic $37,383 |
| Immigrants | Dominican Republic | 0.1 /100 | #295 | Tragic $37,306 |
| Indonesians | 0.1 /100 | #296 | Tragic $37,300 |