Cajun vs Afghan Median Male Earnings
COMPARE
Cajun
Afghan
Median Male Earnings
Median Male Earnings Comparison
Cajuns
Afghans
$52,325
MEDIAN MALE EARNINGS
10.7/ 100
METRIC RATING
212th/ 347
METRIC RANK
$59,554
MEDIAN MALE EARNINGS
99.3/ 100
METRIC RATING
84th/ 347
METRIC RANK
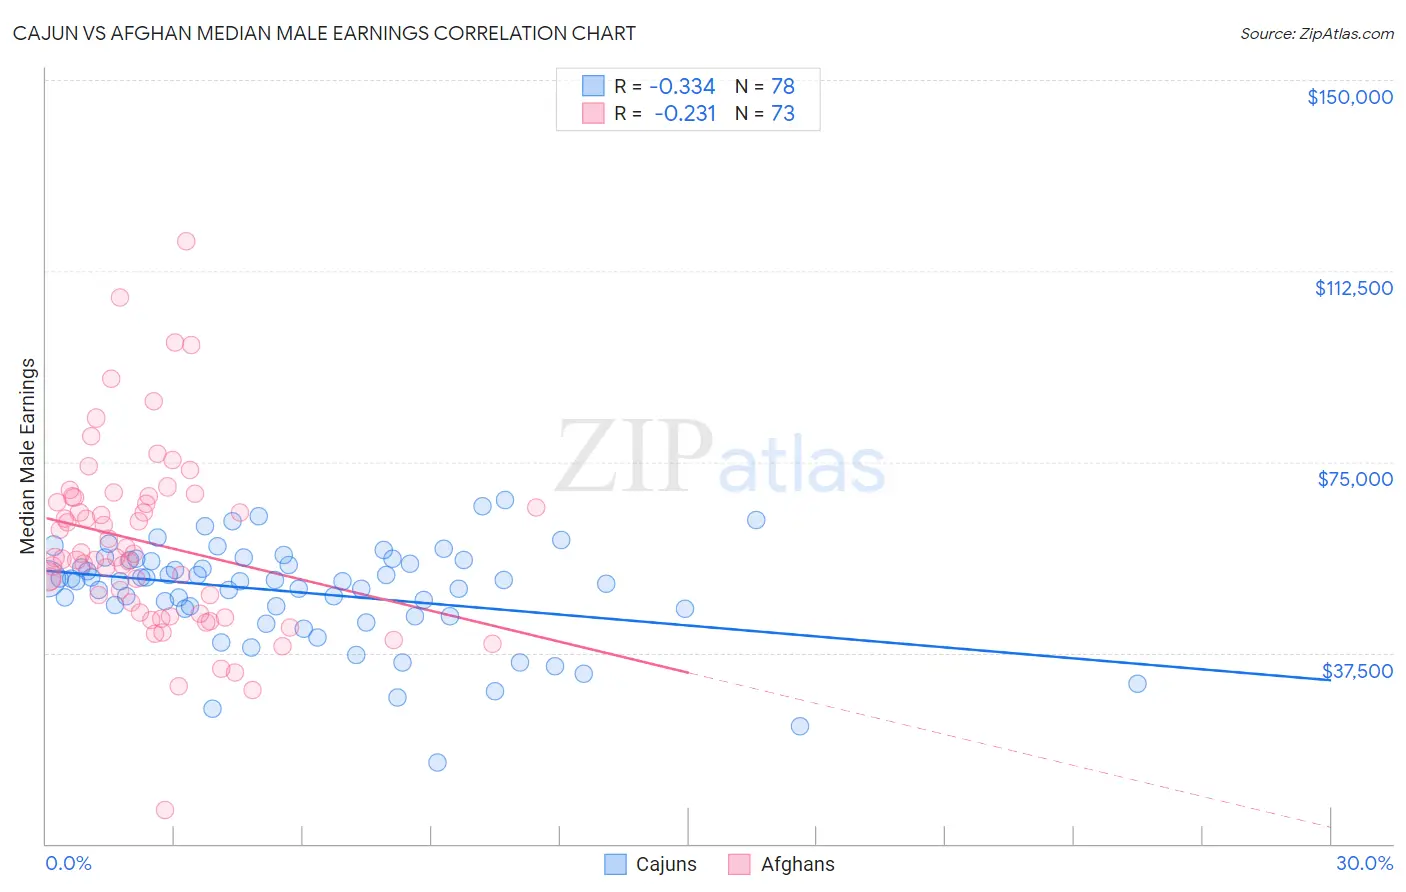
Cajun vs Afghan Median Male Earnings Correlation Chart
The statistical analysis conducted on geographies consisting of 149,660,715 people shows a mild negative correlation between the proportion of Cajuns and median male earnings in the United States with a correlation coefficient (R) of -0.334 and weighted average of $52,325. Similarly, the statistical analysis conducted on geographies consisting of 148,869,100 people shows a weak negative correlation between the proportion of Afghans and median male earnings in the United States with a correlation coefficient (R) of -0.231 and weighted average of $59,554, a difference of 13.8%.
Median Male Earnings Correlation Summary
| Measurement | Cajun | Afghan |
| Minimum | $15,945 | $6,707 |
| Maximum | $67,496 | $118,365 |
| Range | $51,551 | $111,658 |
| Mean | $49,309 | $59,002 |
| Median | $51,622 | $56,261 |
| Interquartile 25% (IQ1) | $46,199 | $45,293 |
| Interquartile 75% (IQ3) | $55,757 | $68,035 |
| Interquartile Range (IQR) | $9,558 | $22,742 |
| Standard Deviation (Sample) | $9,949 | $18,269 |
| Standard Deviation (Population) | $9,885 | $18,144 |
Similar Demographics by Median Male Earnings
Demographics Similar to Cajuns by Median Male Earnings
In terms of median male earnings, the demographic groups most similar to Cajuns are Native Hawaiian ($52,306, a difference of 0.040%), Tlingit-Haida ($52,409, a difference of 0.16%), Delaware ($52,412, a difference of 0.17%), Bermudan ($52,465, a difference of 0.27%), and Nonimmigrants ($52,170, a difference of 0.30%).
| Demographics | Rating | Rank | Median Male Earnings |
| Immigrants | Colombia | 15.0 /100 | #205 | Poor $52,725 |
| Immigrants | Iraq | 14.5 /100 | #206 | Poor $52,681 |
| Vietnamese | 12.7 /100 | #207 | Poor $52,525 |
| Venezuelans | 12.5 /100 | #208 | Poor $52,510 |
| Bermudans | 12.1 /100 | #209 | Poor $52,465 |
| Delaware | 11.5 /100 | #210 | Poor $52,412 |
| Tlingit-Haida | 11.5 /100 | #211 | Poor $52,409 |
| Cajuns | 10.7 /100 | #212 | Poor $52,325 |
| Native Hawaiians | 10.5 /100 | #213 | Poor $52,306 |
| Immigrants | Nonimmigrants | 9.3 /100 | #214 | Tragic $52,170 |
| Immigrants | Cameroon | 8.9 /100 | #215 | Tragic $52,119 |
| Immigrants | Venezuela | 8.3 /100 | #216 | Tragic $52,041 |
| Nigerians | 8.3 /100 | #217 | Tragic $52,039 |
| Immigrants | Panama | 7.7 /100 | #218 | Tragic $51,962 |
| Immigrants | Ghana | 6.9 /100 | #219 | Tragic $51,836 |
Demographics Similar to Afghans by Median Male Earnings
In terms of median male earnings, the demographic groups most similar to Afghans are Italian ($59,551, a difference of 0.0%), Immigrants from England ($59,527, a difference of 0.050%), Macedonian ($59,522, a difference of 0.050%), Immigrants from Argentina ($59,491, a difference of 0.11%), and Immigrants from Italy ($59,691, a difference of 0.23%).
| Demographics | Rating | Rank | Median Male Earnings |
| Paraguayans | 99.5 /100 | #77 | Exceptional $59,975 |
| Immigrants | Egypt | 99.5 /100 | #78 | Exceptional $59,925 |
| Immigrants | Ukraine | 99.5 /100 | #79 | Exceptional $59,820 |
| Immigrants | Hungary | 99.5 /100 | #80 | Exceptional $59,806 |
| Ukrainians | 99.4 /100 | #81 | Exceptional $59,728 |
| Croatians | 99.4 /100 | #82 | Exceptional $59,715 |
| Immigrants | Italy | 99.4 /100 | #83 | Exceptional $59,691 |
| Afghans | 99.3 /100 | #84 | Exceptional $59,554 |
| Italians | 99.3 /100 | #85 | Exceptional $59,551 |
| Immigrants | England | 99.3 /100 | #86 | Exceptional $59,527 |
| Macedonians | 99.3 /100 | #87 | Exceptional $59,522 |
| Immigrants | Argentina | 99.3 /100 | #88 | Exceptional $59,491 |
| Immigrants | Moldova | 99.2 /100 | #89 | Exceptional $59,417 |
| Austrians | 99.2 /100 | #90 | Exceptional $59,359 |
| Laotians | 99.2 /100 | #91 | Exceptional $59,351 |