Bulgarian vs Immigrants from Sri Lanka Per Capita Income
COMPARE
Bulgarian
Immigrants from Sri Lanka
Per Capita Income
Per Capita Income Comparison
Bulgarians
Immigrants from Sri Lanka
$50,906
PER CAPITA INCOME
100.0/ 100
METRIC RATING
47th/ 347
METRIC RANK
$50,555
PER CAPITA INCOME
100.0/ 100
METRIC RATING
50th/ 347
METRIC RANK
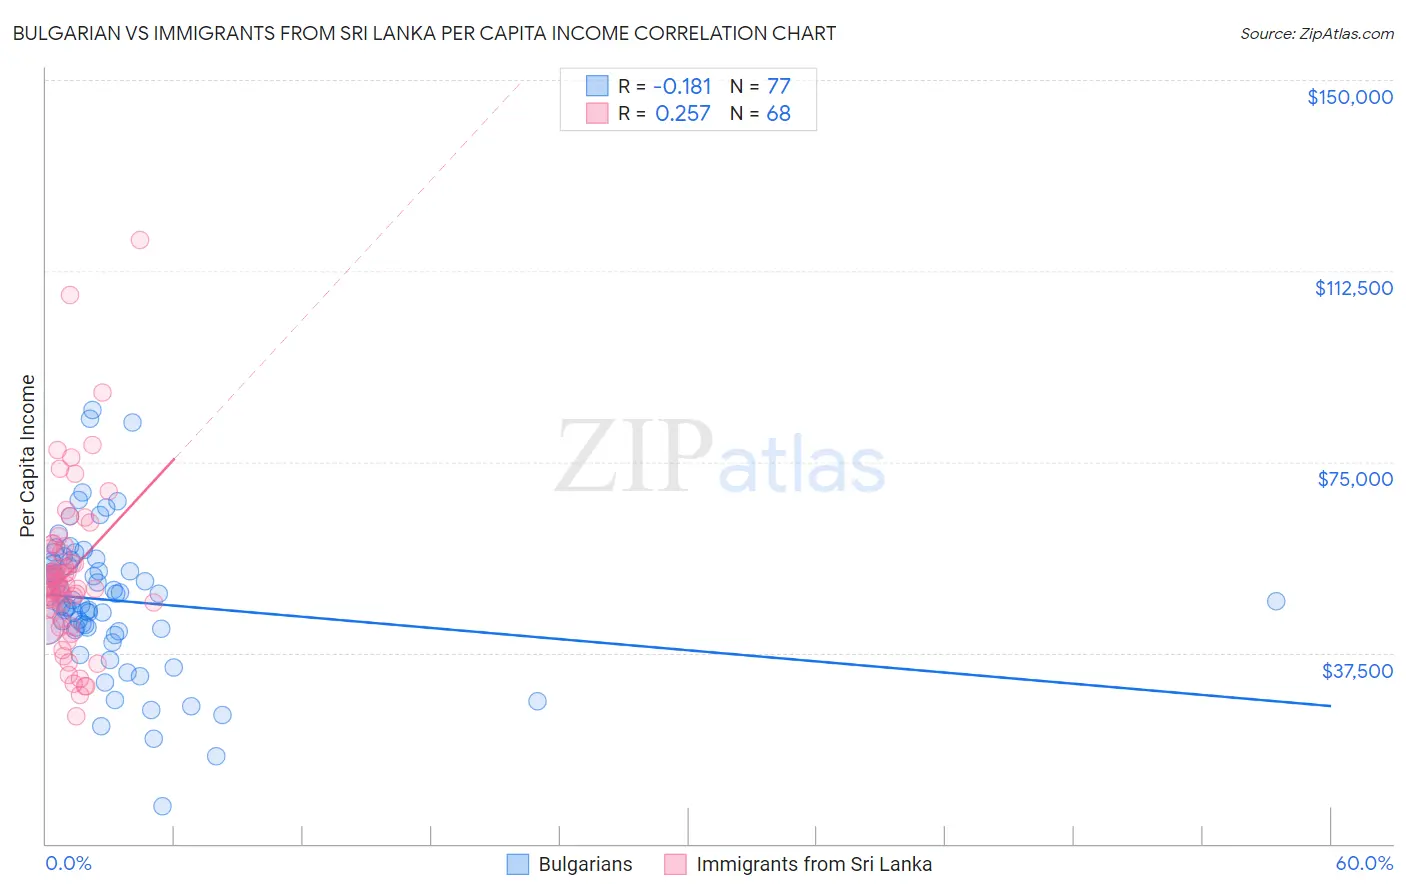
Bulgarian vs Immigrants from Sri Lanka Per Capita Income Correlation Chart
The statistical analysis conducted on geographies consisting of 205,631,200 people shows a poor negative correlation between the proportion of Bulgarians and per capita income in the United States with a correlation coefficient (R) of -0.181 and weighted average of $50,906. Similarly, the statistical analysis conducted on geographies consisting of 149,699,244 people shows a weak positive correlation between the proportion of Immigrants from Sri Lanka and per capita income in the United States with a correlation coefficient (R) of 0.257 and weighted average of $50,555, a difference of 0.69%.
Per Capita Income Correlation Summary
| Measurement | Bulgarian | Immigrants from Sri Lanka |
| Minimum | $7,295 | $24,946 |
| Maximum | $85,161 | $118,591 |
| Range | $77,866 | $93,645 |
| Mean | $47,737 | $53,052 |
| Median | $47,962 | $50,889 |
| Interquartile 25% (IQ1) | $42,061 | $45,023 |
| Interquartile 75% (IQ3) | $55,182 | $58,187 |
| Interquartile Range (IQR) | $13,122 | $13,164 |
| Standard Deviation (Sample) | $13,985 | $16,356 |
| Standard Deviation (Population) | $13,894 | $16,236 |
Demographics Similar to Bulgarians and Immigrants from Sri Lanka by Per Capita Income
In terms of per capita income, the demographic groups most similar to Bulgarians are Immigrants from Latvia ($50,914, a difference of 0.020%), Immigrants from Spain ($50,933, a difference of 0.050%), Immigrants from Europe ($50,950, a difference of 0.090%), Immigrants from Serbia ($50,810, a difference of 0.19%), and New Zealander ($50,575, a difference of 0.65%). Similarly, the demographic groups most similar to Immigrants from Sri Lanka are New Zealander ($50,575, a difference of 0.040%), Immigrants from Netherlands ($50,458, a difference of 0.19%), Immigrants from Croatia ($50,417, a difference of 0.27%), Paraguayan ($50,385, a difference of 0.34%), and Immigrants from Serbia ($50,810, a difference of 0.50%).
| Demographics | Rating | Rank | Per Capita Income |
| Immigrants | Czechoslovakia | 100.0 /100 | #38 | Exceptional $51,770 |
| Cambodians | 100.0 /100 | #39 | Exceptional $51,731 |
| Immigrants | Korea | 100.0 /100 | #40 | Exceptional $51,671 |
| Immigrants | South Africa | 100.0 /100 | #41 | Exceptional $51,465 |
| Immigrants | Turkey | 100.0 /100 | #42 | Exceptional $51,368 |
| Immigrants | Lithuania | 100.0 /100 | #43 | Exceptional $51,361 |
| Immigrants | Europe | 100.0 /100 | #44 | Exceptional $50,950 |
| Immigrants | Spain | 100.0 /100 | #45 | Exceptional $50,933 |
| Immigrants | Latvia | 100.0 /100 | #46 | Exceptional $50,914 |
| Bulgarians | 100.0 /100 | #47 | Exceptional $50,906 |
| Immigrants | Serbia | 100.0 /100 | #48 | Exceptional $50,810 |
| New Zealanders | 100.0 /100 | #49 | Exceptional $50,575 |
| Immigrants | Sri Lanka | 100.0 /100 | #50 | Exceptional $50,555 |
| Immigrants | Netherlands | 100.0 /100 | #51 | Exceptional $50,458 |
| Immigrants | Croatia | 99.9 /100 | #52 | Exceptional $50,417 |
| Paraguayans | 99.9 /100 | #53 | Exceptional $50,385 |
| Immigrants | Belarus | 99.9 /100 | #54 | Exceptional $50,303 |
| Immigrants | Western Europe | 99.9 /100 | #55 | Exceptional $50,065 |
| Asians | 99.9 /100 | #56 | Exceptional $50,057 |
| South Africans | 99.9 /100 | #57 | Exceptional $50,044 |
| Immigrants | Malaysia | 99.9 /100 | #58 | Exceptional $49,983 |