British West Indian vs Immigrants from Middle Africa Median Household Income
COMPARE
British West Indian
Immigrants from Middle Africa
Median Household Income
Median Household Income Comparison
British West Indians
Immigrants from Middle Africa
$75,647
MEDIAN HOUSEHOLD INCOME
0.2/ 100
METRIC RATING
274th/ 347
METRIC RANK
$77,559
MEDIAN HOUSEHOLD INCOME
0.8/ 100
METRIC RATING
255th/ 347
METRIC RANK
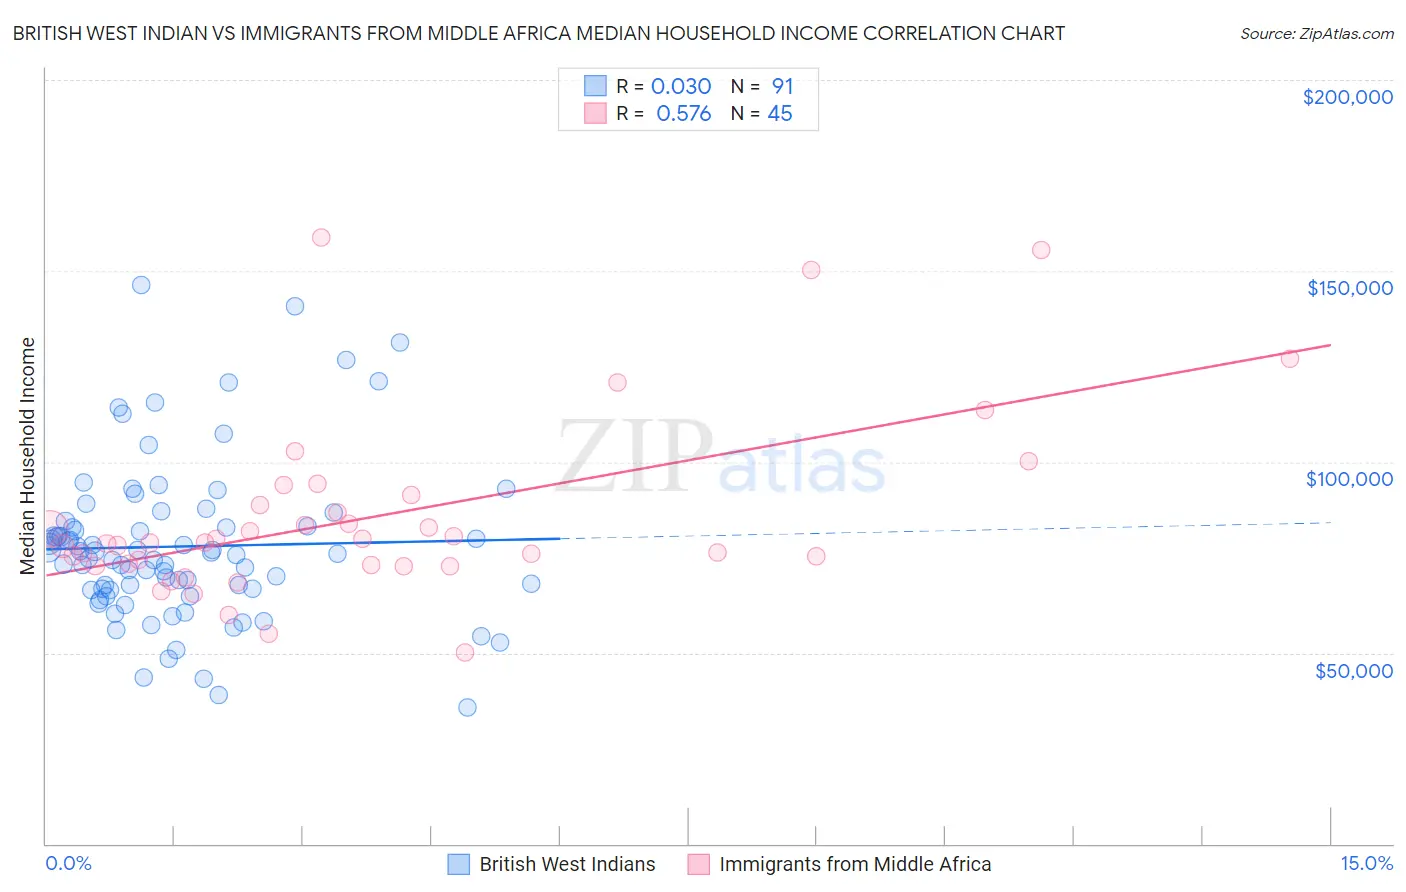
British West Indian vs Immigrants from Middle Africa Median Household Income Correlation Chart
The statistical analysis conducted on geographies consisting of 152,617,098 people shows no correlation between the proportion of British West Indians and median household income in the United States with a correlation coefficient (R) of 0.030 and weighted average of $75,647. Similarly, the statistical analysis conducted on geographies consisting of 202,637,900 people shows a substantial positive correlation between the proportion of Immigrants from Middle Africa and median household income in the United States with a correlation coefficient (R) of 0.576 and weighted average of $77,559, a difference of 2.5%.
Median Household Income Correlation Summary
| Measurement | British West Indian | Immigrants from Middle Africa |
| Minimum | $35,840 | $50,020 |
| Maximum | $146,303 | $158,604 |
| Range | $110,463 | $108,584 |
| Mean | $77,834 | $85,598 |
| Median | $75,947 | $78,726 |
| Interquartile 25% (IQ1) | $66,444 | $72,847 |
| Interquartile 75% (IQ3) | $83,003 | $90,002 |
| Interquartile Range (IQR) | $16,558 | $17,155 |
| Standard Deviation (Sample) | $20,857 | $23,894 |
| Standard Deviation (Population) | $20,742 | $23,627 |
Demographics Similar to British West Indians and Immigrants from Middle Africa by Median Household Income
In terms of median household income, the demographic groups most similar to British West Indians are Liberian ($75,667, a difference of 0.030%), Somali ($75,782, a difference of 0.18%), Pennsylvania German ($75,814, a difference of 0.22%), Hmong ($75,839, a difference of 0.25%), and Immigrants from Jamaica ($75,851, a difference of 0.27%). Similarly, the demographic groups most similar to Immigrants from Middle Africa are Subsaharan African ($77,631, a difference of 0.090%), Belizean ($77,028, a difference of 0.69%), Immigrants from Senegal ($76,915, a difference of 0.84%), Immigrants from Nicaragua ($76,784, a difference of 1.0%), and Spanish American Indian ($76,670, a difference of 1.2%).
| Demographics | Rating | Rank | Median Household Income |
| Sub-Saharan Africans | 0.8 /100 | #254 | Tragic $77,631 |
| Immigrants | Middle Africa | 0.8 /100 | #255 | Tragic $77,559 |
| Belizeans | 0.6 /100 | #256 | Tragic $77,028 |
| Immigrants | Senegal | 0.5 /100 | #257 | Tragic $76,915 |
| Immigrants | Nicaragua | 0.5 /100 | #258 | Tragic $76,784 |
| Spanish American Indians | 0.4 /100 | #259 | Tragic $76,670 |
| Jamaicans | 0.4 /100 | #260 | Tragic $76,583 |
| Immigrants | Grenada | 0.4 /100 | #261 | Tragic $76,517 |
| French American Indians | 0.4 /100 | #262 | Tragic $76,387 |
| Alaskan Athabascans | 0.4 /100 | #263 | Tragic $76,383 |
| Guatemalans | 0.3 /100 | #264 | Tragic $75,961 |
| Immigrants | Belize | 0.3 /100 | #265 | Tragic $75,938 |
| Americans | 0.3 /100 | #266 | Tragic $75,932 |
| German Russians | 0.3 /100 | #267 | Tragic $75,856 |
| Immigrants | Jamaica | 0.3 /100 | #268 | Tragic $75,851 |
| Cape Verdeans | 0.3 /100 | #269 | Tragic $75,848 |
| Hmong | 0.3 /100 | #270 | Tragic $75,839 |
| Pennsylvania Germans | 0.3 /100 | #271 | Tragic $75,814 |
| Somalis | 0.3 /100 | #272 | Tragic $75,782 |
| Liberians | 0.2 /100 | #273 | Tragic $75,667 |
| British West Indians | 0.2 /100 | #274 | Tragic $75,647 |