British vs Immigrants from Taiwan Median Earnings
COMPARE
British
Immigrants from Taiwan
Median Earnings
Median Earnings Comparison
British
Immigrants from Taiwan
$48,189
MEDIAN EARNINGS
92.2/ 100
METRIC RATING
132nd/ 347
METRIC RANK
$61,151
MEDIAN EARNINGS
100.0/ 100
METRIC RATING
2nd/ 347
METRIC RANK
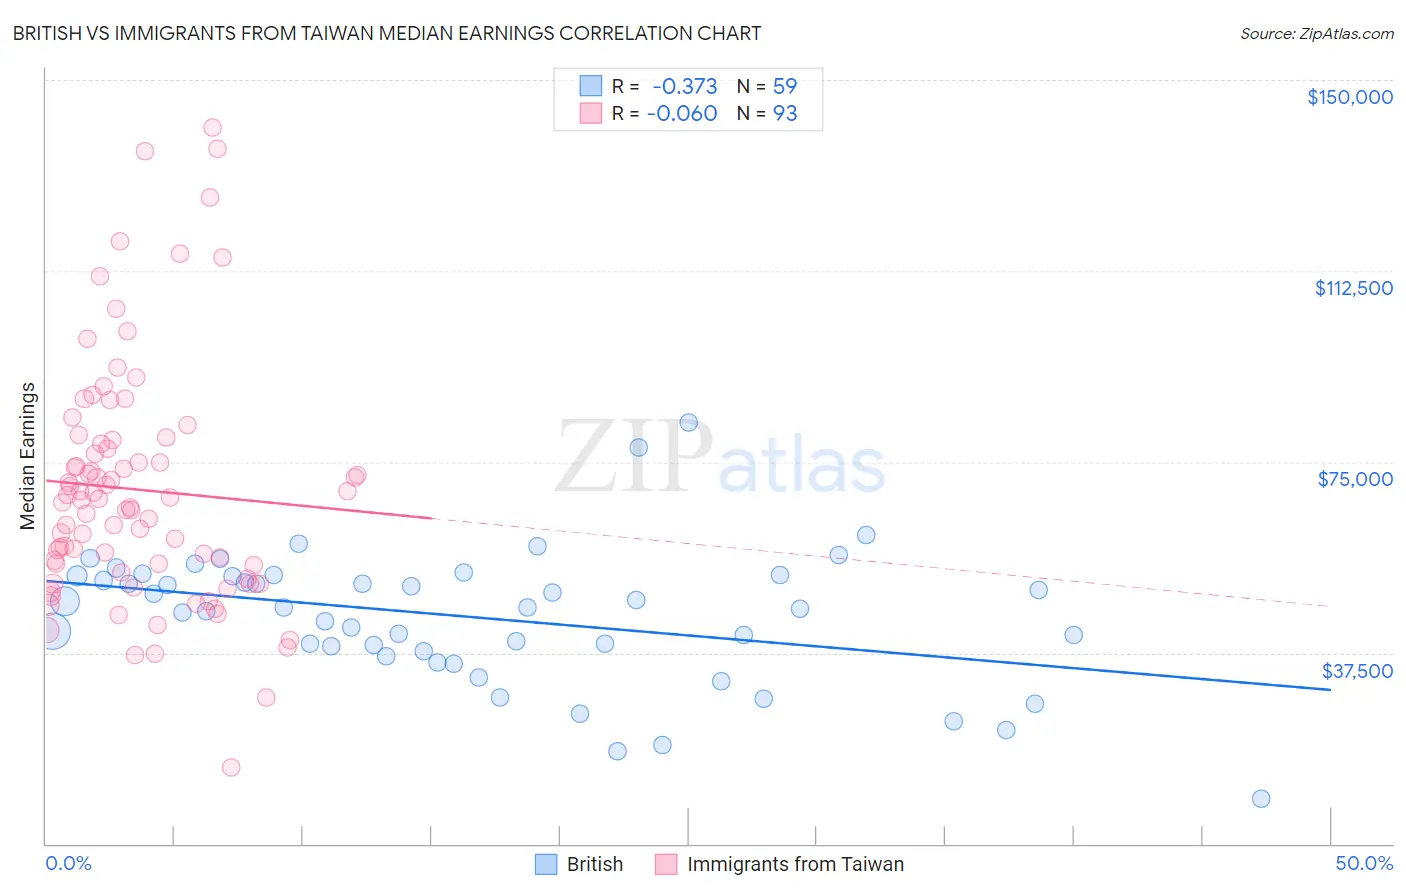
British vs Immigrants from Taiwan Median Earnings Correlation Chart
The statistical analysis conducted on geographies consisting of 531,344,409 people shows a mild negative correlation between the proportion of British and median earnings in the United States with a correlation coefficient (R) of -0.373 and weighted average of $48,189. Similarly, the statistical analysis conducted on geographies consisting of 298,281,567 people shows a slight negative correlation between the proportion of Immigrants from Taiwan and median earnings in the United States with a correlation coefficient (R) of -0.060 and weighted average of $61,151, a difference of 26.9%.
Median Earnings Correlation Summary
| Measurement | British | Immigrants from Taiwan |
| Minimum | $8,915 | $15,000 |
| Maximum | $82,773 | $140,742 |
| Range | $73,858 | $125,742 |
| Mean | $44,491 | $69,540 |
| Median | $46,291 | $67,496 |
| Interquartile 25% (IQ1) | $37,889 | $54,032 |
| Interquartile 75% (IQ3) | $52,582 | $78,915 |
| Interquartile Range (IQR) | $14,693 | $24,883 |
| Standard Deviation (Sample) | $13,191 | $23,624 |
| Standard Deviation (Population) | $13,079 | $23,497 |
Similar Demographics by Median Earnings
Demographics Similar to British by Median Earnings
In terms of median earnings, the demographic groups most similar to British are Zimbabwean ($48,229, a difference of 0.080%), Lebanese ($48,226, a difference of 0.080%), Pakistani ($48,254, a difference of 0.14%), Immigrants from Philippines ($48,266, a difference of 0.16%), and Sierra Leonean ($48,286, a difference of 0.20%).
| Demographics | Rating | Rank | Median Earnings |
| Immigrants | Fiji | 93.3 /100 | #125 | Exceptional $48,305 |
| Assyrians/Chaldeans/Syriacs | 93.3 /100 | #126 | Exceptional $48,304 |
| Sierra Leoneans | 93.1 /100 | #127 | Exceptional $48,286 |
| Immigrants | Philippines | 92.9 /100 | #128 | Exceptional $48,266 |
| Pakistanis | 92.8 /100 | #129 | Exceptional $48,254 |
| Zimbabweans | 92.6 /100 | #130 | Exceptional $48,229 |
| Lebanese | 92.5 /100 | #131 | Exceptional $48,226 |
| British | 92.2 /100 | #132 | Exceptional $48,189 |
| Immigrants | Uganda | 90.5 /100 | #133 | Exceptional $48,041 |
| Sri Lankans | 90.5 /100 | #134 | Exceptional $48,040 |
| Portuguese | 90.4 /100 | #135 | Exceptional $48,032 |
| Slovenes | 90.0 /100 | #136 | Excellent $47,995 |
| Immigrants | Nepal | 89.0 /100 | #137 | Excellent $47,925 |
| Europeans | 88.9 /100 | #138 | Excellent $47,915 |
| Canadians | 88.8 /100 | #139 | Excellent $47,911 |
Demographics Similar to Immigrants from Taiwan by Median Earnings
In terms of median earnings, the demographic groups most similar to Immigrants from Taiwan are Filipino ($61,197, a difference of 0.080%), Immigrants from India ($60,648, a difference of 0.83%), Immigrants from Hong Kong ($59,433, a difference of 2.9%), Thai ($59,237, a difference of 3.2%), and Immigrants from Singapore ($59,038, a difference of 3.6%).
| Demographics | Rating | Rank | Median Earnings |
| Filipinos | 100.0 /100 | #1 | Exceptional $61,197 |
| Immigrants | Taiwan | 100.0 /100 | #2 | Exceptional $61,151 |
| Immigrants | India | 100.0 /100 | #3 | Exceptional $60,648 |
| Immigrants | Hong Kong | 100.0 /100 | #4 | Exceptional $59,433 |
| Thais | 100.0 /100 | #5 | Exceptional $59,237 |
| Immigrants | Singapore | 100.0 /100 | #6 | Exceptional $59,038 |
| Iranians | 100.0 /100 | #7 | Exceptional $58,474 |
| Immigrants | Iran | 100.0 /100 | #8 | Exceptional $57,612 |
| Okinawans | 100.0 /100 | #9 | Exceptional $57,550 |
| Immigrants | South Central Asia | 100.0 /100 | #10 | Exceptional $57,114 |
| Immigrants | Israel | 100.0 /100 | #11 | Exceptional $57,034 |
| Immigrants | Ireland | 100.0 /100 | #12 | Exceptional $56,854 |
| Immigrants | China | 100.0 /100 | #13 | Exceptional $56,638 |
| Immigrants | Australia | 100.0 /100 | #14 | Exceptional $56,305 |
| Indians (Asian) | 100.0 /100 | #15 | Exceptional $56,253 |