British vs Immigrants from Southern Europe Median Family Income
COMPARE
British
Immigrants from Southern Europe
Median Family Income
Median Family Income Comparison
British
Immigrants from Southern Europe
$108,705
MEDIAN FAMILY INCOME
95.6/ 100
METRIC RATING
110th/ 347
METRIC RANK
$110,614
MEDIAN FAMILY INCOME
98.3/ 100
METRIC RATING
91st/ 347
METRIC RANK
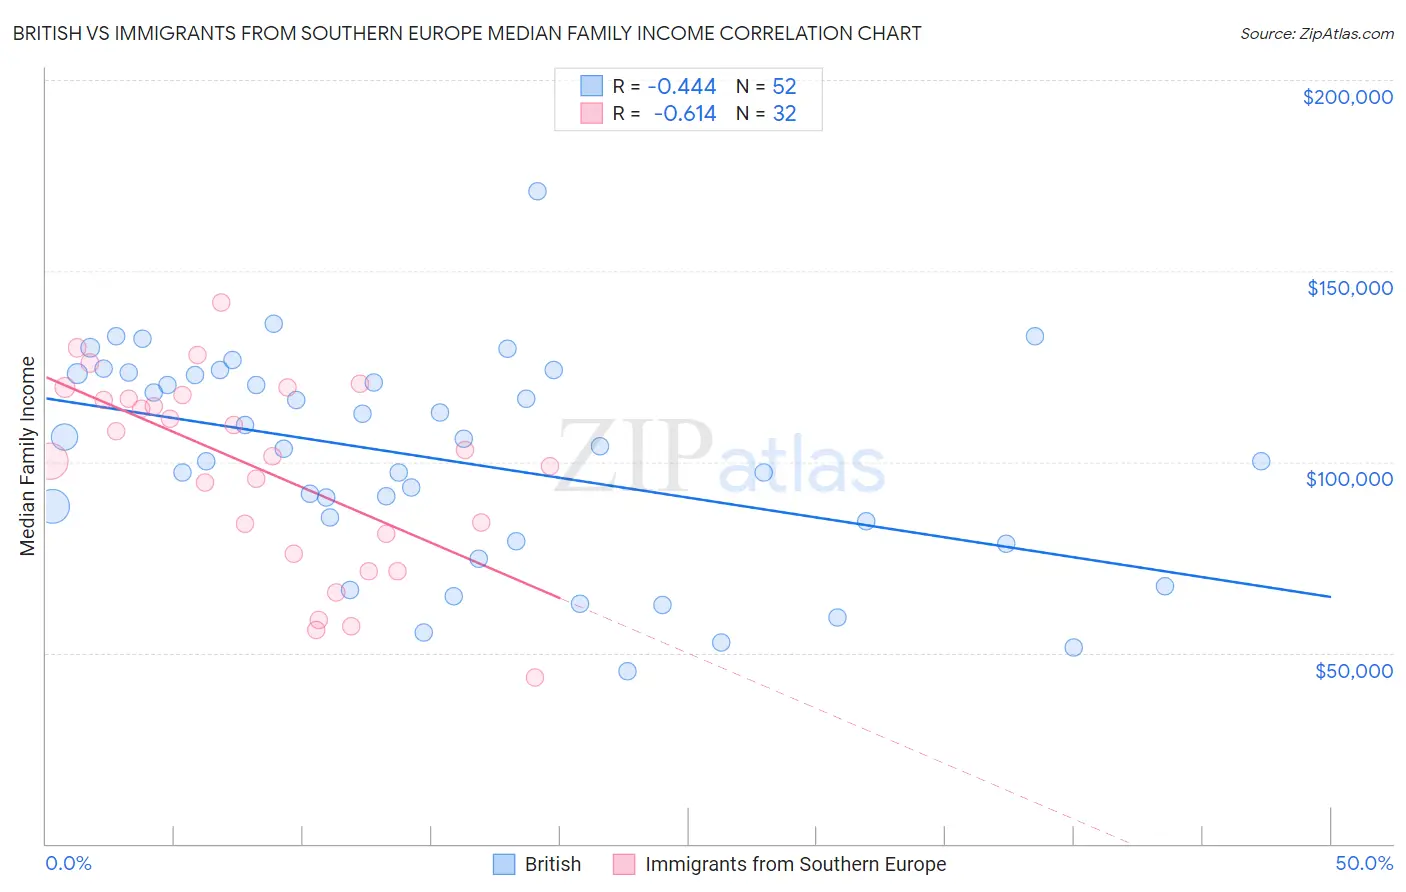
British vs Immigrants from Southern Europe Median Family Income Correlation Chart
The statistical analysis conducted on geographies consisting of 530,672,110 people shows a moderate negative correlation between the proportion of British and median family income in the United States with a correlation coefficient (R) of -0.444 and weighted average of $108,705. Similarly, the statistical analysis conducted on geographies consisting of 402,509,296 people shows a significant negative correlation between the proportion of Immigrants from Southern Europe and median family income in the United States with a correlation coefficient (R) of -0.614 and weighted average of $110,614, a difference of 1.8%.
Median Family Income Correlation Summary
| Measurement | British | Immigrants from Southern Europe |
| Minimum | $45,060 | $43,571 |
| Maximum | $170,856 | $141,836 |
| Range | $125,796 | $98,265 |
| Mean | $100,714 | $97,967 |
| Median | $103,902 | $102,217 |
| Interquartile 25% (IQ1) | $81,768 | $78,639 |
| Interquartile 75% (IQ3) | $123,002 | $117,023 |
| Interquartile Range (IQR) | $41,234 | $38,384 |
| Standard Deviation (Sample) | $27,270 | $25,189 |
| Standard Deviation (Population) | $27,007 | $24,793 |
Demographics Similar to British and Immigrants from Southern Europe by Median Family Income
In terms of median family income, the demographic groups most similar to British are Immigrants from Afghanistan ($108,709, a difference of 0.0%), Immigrants from Zimbabwe ($108,830, a difference of 0.12%), Albanian ($109,136, a difference of 0.40%), Immigrants from North Macedonia ($109,136, a difference of 0.40%), and Syrian ($109,299, a difference of 0.55%). Similarly, the demographic groups most similar to Immigrants from Southern Europe are Northern European ($110,635, a difference of 0.020%), Immigrants from Lebanon ($110,159, a difference of 0.41%), Immigrants from Kazakhstan ($110,137, a difference of 0.43%), Korean ($110,103, a difference of 0.46%), and Zimbabwean ($110,011, a difference of 0.55%).
| Demographics | Rating | Rank | Median Family Income |
| Northern Europeans | 98.3 /100 | #90 | Exceptional $110,635 |
| Immigrants | Southern Europe | 98.3 /100 | #91 | Exceptional $110,614 |
| Immigrants | Lebanon | 97.9 /100 | #92 | Exceptional $110,159 |
| Immigrants | Kazakhstan | 97.8 /100 | #93 | Exceptional $110,137 |
| Koreans | 97.8 /100 | #94 | Exceptional $110,103 |
| Zimbabweans | 97.7 /100 | #95 | Exceptional $110,011 |
| Immigrants | Moldova | 97.7 /100 | #96 | Exceptional $109,975 |
| Jordanians | 97.5 /100 | #97 | Exceptional $109,865 |
| Immigrants | Kuwait | 97.4 /100 | #98 | Exceptional $109,731 |
| Armenians | 97.3 /100 | #99 | Exceptional $109,692 |
| Macedonians | 97.3 /100 | #100 | Exceptional $109,668 |
| Immigrants | Ukraine | 97.2 /100 | #101 | Exceptional $109,645 |
| Assyrians/Chaldeans/Syriacs | 97.2 /100 | #102 | Exceptional $109,622 |
| Immigrants | Brazil | 96.9 /100 | #103 | Exceptional $109,418 |
| Palestinians | 96.9 /100 | #104 | Exceptional $109,413 |
| Syrians | 96.7 /100 | #105 | Exceptional $109,299 |
| Albanians | 96.4 /100 | #106 | Exceptional $109,136 |
| Immigrants | North Macedonia | 96.4 /100 | #107 | Exceptional $109,136 |
| Immigrants | Zimbabwe | 95.9 /100 | #108 | Exceptional $108,830 |
| Immigrants | Afghanistan | 95.6 /100 | #109 | Exceptional $108,709 |
| British | 95.6 /100 | #110 | Exceptional $108,705 |