Brazilian vs Immigrants from France Median Male Earnings
COMPARE
Brazilian
Immigrants from France
Median Male Earnings
Median Male Earnings Comparison
Brazilians
Immigrants from France
$56,837
MEDIAN MALE EARNINGS
90.9/ 100
METRIC RATING
127th/ 347
METRIC RANK
$63,715
MEDIAN MALE EARNINGS
100.0/ 100
METRIC RATING
30th/ 347
METRIC RANK
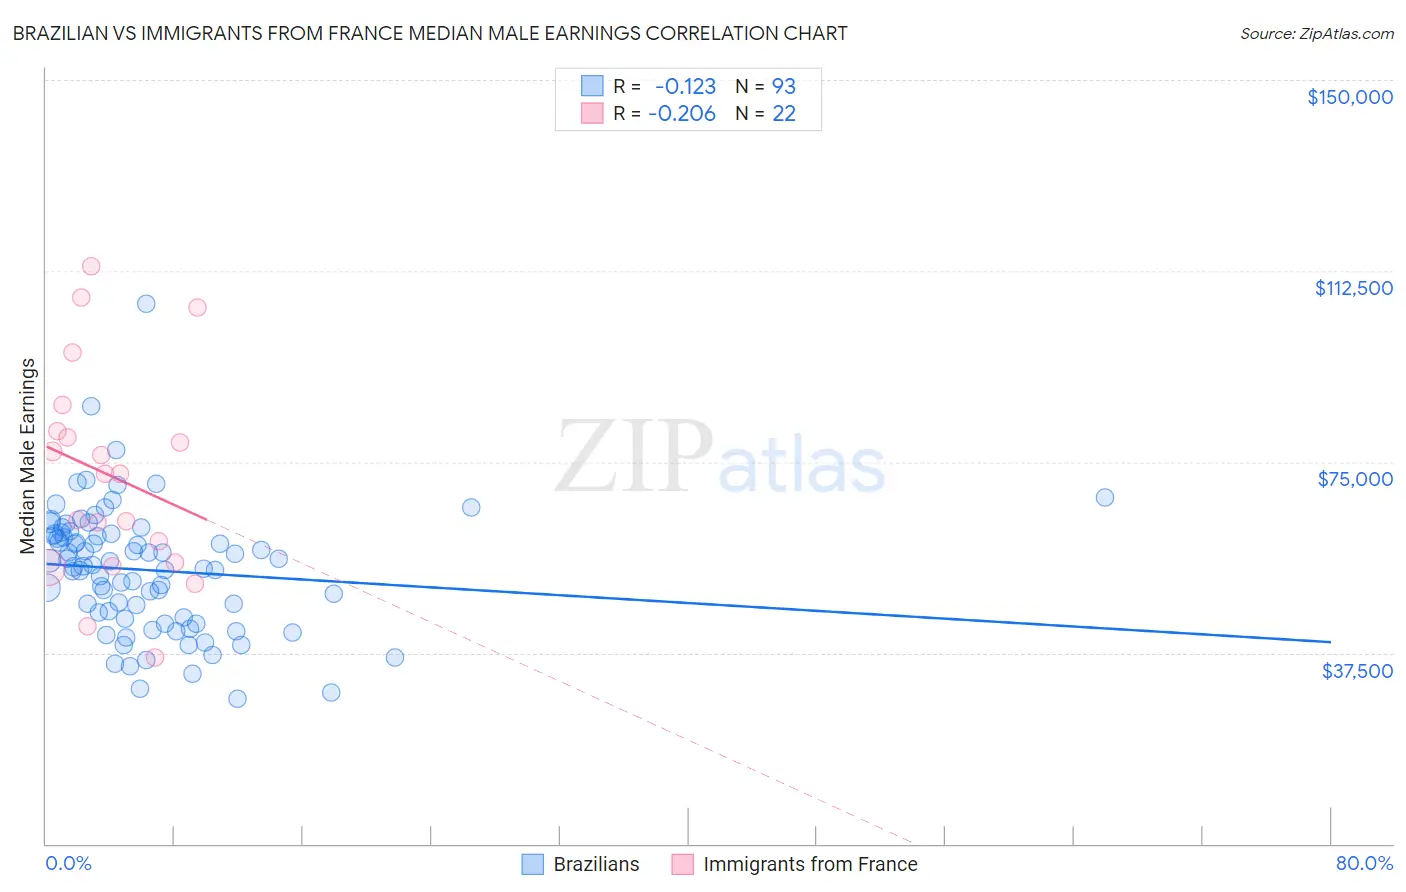
Brazilian vs Immigrants from France Median Male Earnings Correlation Chart
The statistical analysis conducted on geographies consisting of 323,892,839 people shows a poor negative correlation between the proportion of Brazilians and median male earnings in the United States with a correlation coefficient (R) of -0.123 and weighted average of $56,837. Similarly, the statistical analysis conducted on geographies consisting of 287,844,357 people shows a weak negative correlation between the proportion of Immigrants from France and median male earnings in the United States with a correlation coefficient (R) of -0.206 and weighted average of $63,715, a difference of 12.1%.
Median Male Earnings Correlation Summary
| Measurement | Brazilian | Immigrants from France |
| Minimum | $28,554 | $36,667 |
| Maximum | $105,938 | $113,322 |
| Range | $77,384 | $76,655 |
| Mean | $53,733 | $72,320 |
| Median | $54,435 | $72,692 |
| Interquartile 25% (IQ1) | $44,298 | $55,273 |
| Interquartile 75% (IQ3) | $60,844 | $81,126 |
| Interquartile Range (IQR) | $16,546 | $25,853 |
| Standard Deviation (Sample) | $12,418 | $20,619 |
| Standard Deviation (Population) | $12,351 | $20,145 |
Similar Demographics by Median Male Earnings
Demographics Similar to Brazilians by Median Male Earnings
In terms of median male earnings, the demographic groups most similar to Brazilians are Immigrants from Syria ($56,830, a difference of 0.010%), Chinese ($56,872, a difference of 0.060%), Immigrants from Morocco ($56,958, a difference of 0.21%), Pakistani ($56,719, a difference of 0.21%), and Chilean ($56,973, a difference of 0.24%).
| Demographics | Rating | Rank | Median Male Earnings |
| Canadians | 93.9 /100 | #120 | Exceptional $57,286 |
| Immigrants | Albania | 93.3 /100 | #121 | Exceptional $57,179 |
| Immigrants | Jordan | 93.1 /100 | #122 | Exceptional $57,145 |
| Slovenes | 93.1 /100 | #123 | Exceptional $57,145 |
| Chileans | 91.9 /100 | #124 | Exceptional $56,973 |
| Immigrants | Morocco | 91.8 /100 | #125 | Exceptional $56,958 |
| Chinese | 91.1 /100 | #126 | Exceptional $56,872 |
| Brazilians | 90.9 /100 | #127 | Exceptional $56,837 |
| Immigrants | Syria | 90.8 /100 | #128 | Exceptional $56,830 |
| Pakistanis | 89.9 /100 | #129 | Excellent $56,719 |
| Koreans | 89.4 /100 | #130 | Excellent $56,672 |
| Portuguese | 89.4 /100 | #131 | Excellent $56,663 |
| Czechs | 88.2 /100 | #132 | Excellent $56,546 |
| Immigrants | Germany | 88.2 /100 | #133 | Excellent $56,542 |
| Moroccans | 87.7 /100 | #134 | Excellent $56,499 |
Demographics Similar to Immigrants from France by Median Male Earnings
In terms of median male earnings, the demographic groups most similar to Immigrants from France are Asian ($63,827, a difference of 0.18%), Latvian ($63,498, a difference of 0.34%), Russian ($63,939, a difference of 0.35%), Immigrants from Switzerland ($63,944, a difference of 0.36%), and Soviet Union ($63,382, a difference of 0.53%).
| Demographics | Rating | Rank | Median Male Earnings |
| Immigrants | Korea | 100.0 /100 | #23 | Exceptional $65,079 |
| Immigrants | Northern Europe | 100.0 /100 | #24 | Exceptional $64,987 |
| Immigrants | Denmark | 100.0 /100 | #25 | Exceptional $64,625 |
| Turks | 100.0 /100 | #26 | Exceptional $64,253 |
| Immigrants | Switzerland | 100.0 /100 | #27 | Exceptional $63,944 |
| Russians | 100.0 /100 | #28 | Exceptional $63,939 |
| Asians | 100.0 /100 | #29 | Exceptional $63,827 |
| Immigrants | France | 100.0 /100 | #30 | Exceptional $63,715 |
| Latvians | 100.0 /100 | #31 | Exceptional $63,498 |
| Soviet Union | 100.0 /100 | #32 | Exceptional $63,382 |
| Immigrants | Lithuania | 100.0 /100 | #33 | Exceptional $63,346 |
| Immigrants | Russia | 100.0 /100 | #34 | Exceptional $63,326 |
| Immigrants | Asia | 100.0 /100 | #35 | Exceptional $63,240 |
| Israelis | 100.0 /100 | #36 | Exceptional $63,228 |
| Immigrants | Sri Lanka | 100.0 /100 | #37 | Exceptional $63,099 |