Brazilian vs Croatian Householder Income Ages 25 - 44 years

COMPARE

Brazilian
Race
Ancestry
AfghanAfricanAlaska NativeAlaskan AthabascanAlbanianAleutAlsatianAmericanApacheArabArapahoArgentineanArmenianAssyrian/Chaldean/SyriacAustralianAustrianBahamianBangladeshiBarbadianBasqueBelgianBelizeanBermudanBhutaneseBlackfeetBolivianBrazilianBritishBritish West IndianBulgarianBurmeseCajunCambodianCanadianCape VerdeanCarpatho RusynCelticCentral AmericanCentral American IndianCherokeeCheyenneChickasawChileanChineseChippewaChoctawColombianColvilleComancheCosta RicanCreeCreekCrowCubanCypriotCzechCzechoslovakianDanishDelawareDominicanDutchDutch West IndianEastern EuropeanEcuadorianEgyptianEnglishEstonianEthiopianEuropeanFijianFilipinoFinnishFrenchFrench American IndianFrench CanadianGermanGerman RussianGhanaianGreekGuamanian/ChamorroGuatemalanGuyaneseHaitianHmongHonduranHopiHoumaHungarianIcelanderIndian (Asian)IndonesianInupiatIranianIraqiIrishIroquoisIsraeliItalianJamaicanJapaneseJordanianKenyanKiowaKoreanLaotianLatvianLebaneseLiberianLithuanianLumbeeLuxembourgerMacedonianMalaysianMalteseMarshalleseMenomineeMexicanMexican American IndianMongolianMoroccanNative HawaiianNavajoNepaleseNew ZealanderNicaraguanNigerianNorthern EuropeanNorwegianOkinawanOsageOttawaPaiutePakistaniPalestinianPanamanianParaguayanPennsylvania GermanPeruvianPimaPolishPortuguesePotawatomiPuebloPuerto RicanPuget Sound SalishRomanianRussianSalvadoranSamoanScandinavianScotch-IrishScottishSeminoleSenegaleseSerbianShoshoneSierra LeoneanSiouxSlavicSlovakSloveneSomaliSouth AfricanSouth AmericanSouth American IndianSoviet UnionSpaniardSpanishSpanish AmericanSpanish American IndianSri LankanSubsaharan AfricanSudaneseSwedishSwissSyrianTaiwaneseThaiTlingit-HaidaTohono O'OdhamTonganTrinidadian and TobagonianTsimshianTurkishU.S. Virgin IslanderUgandanUkrainianUruguayanUteVenezuelanVietnameseWelshWest IndianYakamaYaquiYugoslavianYumanYup'ikZimbabwean
Immigration
NonimmigrantsImmigrantsAfghanistanAfricaAlbaniaArgentinaArmeniaAsiaAustraliaAustriaBahamasBangladeshBarbadosBelarusBelgiumBelizeBoliviaBosnia and HerzegovinaBrazilBulgariaBurma/MyanmarCabo VerdeCambodiaCameroonCanadaCaribbeanCentral AmericaChileChinaColombiaCongoCosta RicaCroatiaCubaCzechoslovakiaDenmarkDominicaDominican RepublicEastern AfricaEastern AsiaEastern EuropeEcuadorEgyptEl SalvadorEnglandEritreaEthiopiaEuropeFijiFranceGermanyGhanaGreeceGrenadaGuatemalaGuyanaHaitiHondurasHong KongHungaryIndiaIndonesiaIranIraqIrelandIsraelItalyJamaicaJapanJordanKazakhstanKenyaKoreaKuwaitLaosLatin AmericaLatviaLebanonLiberiaLithuaniaMalaysiaMexicoMicronesiaMiddle AfricaMoldovaMoroccoNepalNetherlandsNicaraguaNigeriaNorth AmericaNorth MacedoniaNorthern AfricaNorthern EuropeNorwayOceaniaPakistanPanamaPeruPhilippinesPolandPortugalRomaniaRussiaSaudi ArabiaScotlandSenegalSerbiaSierra LeoneSingaporeSomaliaSouth AfricaSouth AmericaSouth Central AsiaSouth Eastern AsiaSouthern EuropeSpainSri LankaSt. Vincent and the GrenadinesSudanSwedenSwitzerlandSyriaTaiwanThailandTrinidad and TobagoTurkeyUgandaUkraineUruguayUzbekistanVenezuelaVietnamWest IndiesWestern AfricaWestern AsiaWestern EuropeYemenZaireZimbabweAzores
Croatian
Race
Ancestry
AfghanAfricanAlaska NativeAlaskan AthabascanAlbanianAleutAlsatianAmericanApacheArabArapahoArgentineanArmenianAssyrian/Chaldean/SyriacAustralianAustrianBahamianBangladeshiBarbadianBasqueBelgianBelizeanBermudanBhutaneseBlackfeetBolivianBritishBritish West IndianBulgarianBurmeseCajunCambodianCanadianCape VerdeanCarpatho RusynCelticCentral AmericanCentral American IndianCherokeeCheyenneChickasawChileanChineseChippewaChoctawColombianColvilleComancheCosta RicanCreeCreekCroatianCrowCubanCypriotCzechCzechoslovakianDanishDelawareDominicanDutchDutch West IndianEastern EuropeanEcuadorianEgyptianEnglishEstonianEthiopianEuropeanFijianFilipinoFinnishFrenchFrench American IndianFrench CanadianGermanGerman RussianGhanaianGreekGuamanian/ChamorroGuatemalanGuyaneseHaitianHmongHonduranHopiHoumaHungarianIcelanderIndian (Asian)IndonesianInupiatIranianIraqiIrishIroquoisIsraeliItalianJamaicanJapaneseJordanianKenyanKiowaKoreanLaotianLatvianLebaneseLiberianLithuanianLumbeeLuxembourgerMacedonianMalaysianMalteseMarshalleseMenomineeMexicanMexican American IndianMongolianMoroccanNative HawaiianNavajoNepaleseNew ZealanderNicaraguanNigerianNorthern EuropeanNorwegianOkinawanOsageOttawaPaiutePakistaniPalestinianPanamanianParaguayanPennsylvania GermanPeruvianPimaPolishPortuguesePotawatomiPuebloPuerto RicanPuget Sound SalishRomanianRussianSalvadoranSamoanScandinavianScotch-IrishScottishSeminoleSenegaleseSerbianShoshoneSierra LeoneanSiouxSlavicSlovakSloveneSomaliSouth AfricanSouth AmericanSouth American IndianSoviet UnionSpaniardSpanishSpanish AmericanSpanish American IndianSri LankanSubsaharan AfricanSudaneseSwedishSwissSyrianTaiwaneseThaiTlingit-HaidaTohono O'OdhamTonganTrinidadian and TobagonianTsimshianTurkishU.S. Virgin IslanderUgandanUkrainianUruguayanUteVenezuelanVietnameseWelshWest IndianYakamaYaquiYugoslavianYumanYup'ikZimbabwean
Immigration
NonimmigrantsImmigrantsAfghanistanAfricaAlbaniaArgentinaArmeniaAsiaAustraliaAustriaBahamasBangladeshBarbadosBelarusBelgiumBelizeBoliviaBosnia and HerzegovinaBrazilBulgariaBurma/MyanmarCabo VerdeCambodiaCameroonCanadaCaribbeanCentral AmericaChileChinaColombiaCongoCosta RicaCroatiaCubaCzechoslovakiaDenmarkDominicaDominican RepublicEastern AfricaEastern AsiaEastern EuropeEcuadorEgyptEl SalvadorEnglandEritreaEthiopiaEuropeFijiFranceGermanyGhanaGreeceGrenadaGuatemalaGuyanaHaitiHondurasHong KongHungaryIndiaIndonesiaIranIraqIrelandIsraelItalyJamaicaJapanJordanKazakhstanKenyaKoreaKuwaitLaosLatin AmericaLatviaLebanonLiberiaLithuaniaMalaysiaMexicoMicronesiaMiddle AfricaMoldovaMoroccoNepalNetherlandsNicaraguaNigeriaNorth AmericaNorth MacedoniaNorthern AfricaNorthern EuropeNorwayOceaniaPakistanPanamaPeruPhilippinesPolandPortugalRomaniaRussiaSaudi ArabiaScotlandSenegalSerbiaSierra LeoneSingaporeSomaliaSouth AfricaSouth AmericaSouth Central AsiaSouth Eastern AsiaSouthern EuropeSpainSri LankaSt. Vincent and the GrenadinesSudanSwedenSwitzerlandSyriaTaiwanThailandTrinidad and TobagoTurkeyUgandaUkraineUruguayUzbekistanVenezuelaVietnamWest IndiesWestern AfricaWestern AsiaWestern EuropeYemenZaireZimbabweAzores
Householder Income Ages 25 - 44 years
Income
Poverty
Unemployment
Labor Participation
Family Structure
Vehicle Availability
Education Level
Disability

Householder Income Ages 25 - 44 years Comparison

Brazilians

Croatians

Excellent
Exceptional
$98,267
HOUSEHOLDER INCOME AGES 25 - 44 YEARS
88.6/ 100
METRIC RATING
129th/ 347
METRIC RANK
$102,414
HOUSEHOLDER INCOME AGES 25 - 44 YEARS
98.7/ 100
METRIC RATING
91st/ 347
METRIC RANK

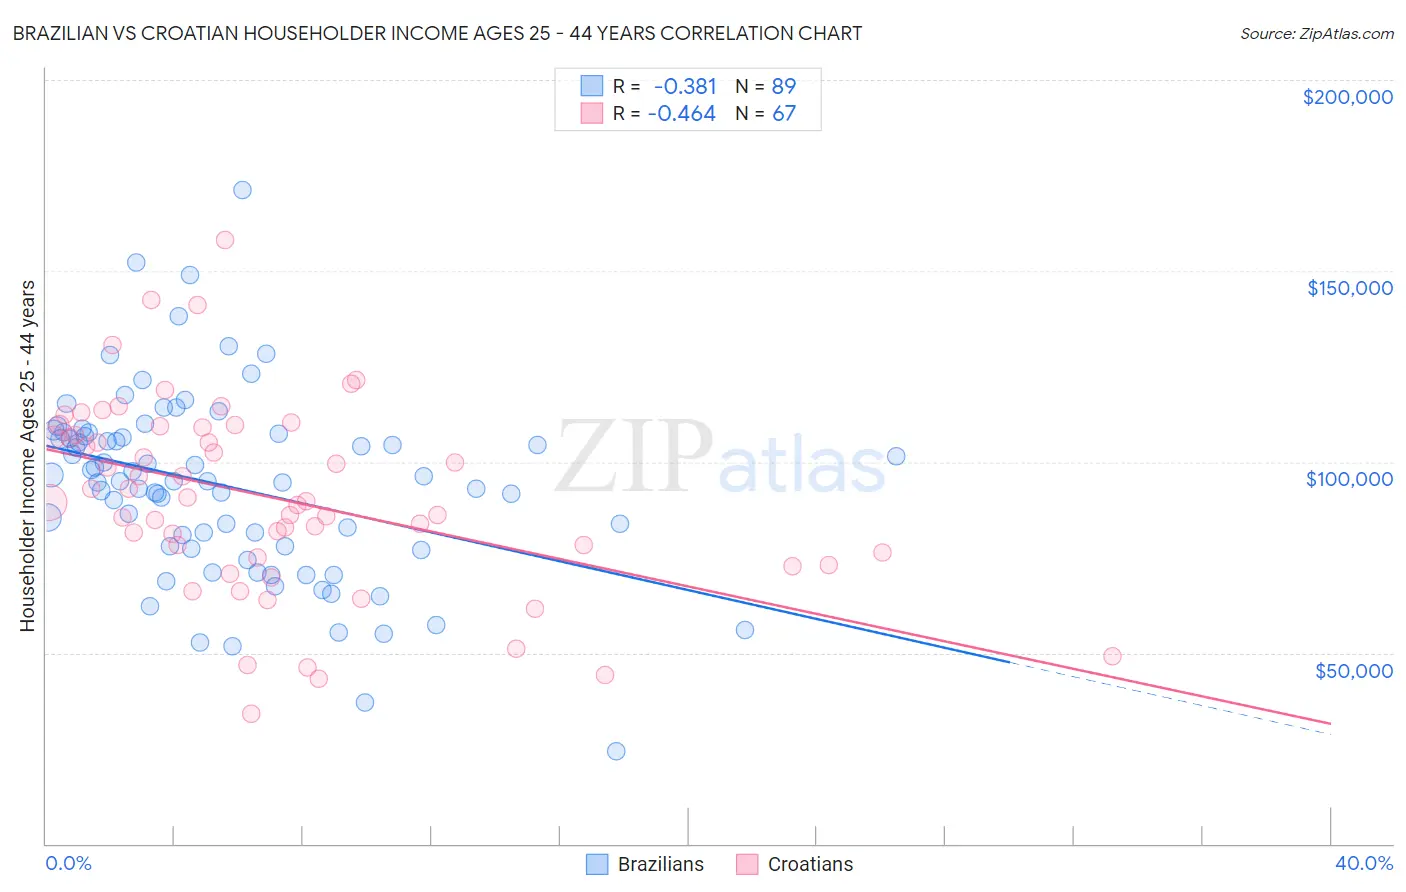
Brazilian vs Croatian Householder Income Ages 25 - 44 years Correlation Chart

The statistical analysis conducted on geographies consisting of 323,332,092 people shows a mild negative correlation between the proportion of Brazilians and household income with householder between the ages 25 and 44 in the United States with a correlation coefficient (R) of -0.381 and weighted average of $98,267. Similarly, the statistical analysis conducted on geographies consisting of 374,641,532 people shows a moderate negative correlation between the proportion of Croatians and household income with householder between the ages 25 and 44 in the United States with a correlation coefficient (R) of -0.464 and weighted average of $102,414, a difference of 4.2%.
Brazilian vs Croatian Householder Income Ages 25 - 44 years

Householder Income Ages 25 - 44 years Correlation Summary

MeasurementBrazilianCroatian
Minimum$24,240$33,958
Maximum$171,042$158,158
Range$146,802$124,200
Mean$93,547$90,676
Median$94,950$89,581
Interquartile 25% (IQ1)$77,657$75,000
Interquartile 75% (IQ3)$107,059$109,113
Interquartile Range (IQR)$29,402$34,113
Standard Deviation (Sample)$24,480$25,045
Standard Deviation (Population)$24,342$24,857

Similar Demographics by Householder Income Ages 25 - 44 years

Demographics Similar to Brazilians by Householder Income Ages 25 - 44 years

In terms of householder income ages 25 - 44 years, the demographic groups most similar to Brazilians are European ($98,310, a difference of 0.040%), Serbian ($98,320, a difference of 0.050%), British ($98,359, a difference of 0.090%), Pakistani ($98,401, a difference of 0.14%), and Immigrants from Kuwait ($98,122, a difference of 0.15%).
DemographicsRating | RankHouseholder Income Ages 25 - 44 years
Immigrants | Uzbekistan
91.5
/100
|
#122
Exceptional
$98,849
Palestinians
91.2
/100
|
#123
Exceptional
$98,777
Zimbabweans
90.3
/100
|
#124
Exceptional
$98,586
Pakistanis
89.3
/100
|
#125
Excellent
$98,401
British
89.1
/100
|
#126
Excellent
$98,359
Serbians
88.9
/100
|
#127
Excellent
$98,320
Europeans
88.9
/100
|
#128
Excellent
$98,310
Brazilians
88.6
/100
|
#129
Excellent
$98,267
Immigrants | Kuwait
87.8
/100
|
#130
Excellent
$98,122
Immigrants | Albania
86.6
/100
|
#131
Excellent
$97,929
Immigrants | Zimbabwe
86.3
/100
|
#132
Excellent
$97,880
Tsimshian
85.8
/100
|
#133
Excellent
$97,809
Canadians
84.5
/100
|
#134
Excellent
$97,625
Immigrants | Oceania
84.5
/100
|
#135
Excellent
$97,623
Hungarians
83.9
/100
|
#136
Excellent
$97,544

Demographics Similar to Croatians by Householder Income Ages 25 - 44 years

In terms of householder income ages 25 - 44 years, the demographic groups most similar to Croatians are Immigrants from North America ($102,407, a difference of 0.010%), Ukrainian ($102,451, a difference of 0.040%), Romanian ($102,544, a difference of 0.13%), Immigrants from Canada ($102,616, a difference of 0.20%), and Immigrants from Western Europe ($102,654, a difference of 0.23%).
DemographicsRating | RankHouseholder Income Ages 25 - 44 years
Immigrants | Philippines
99.0
/100
|
#84
Exceptional
$102,910
Immigrants | Ukraine
98.9
/100
|
#85
Exceptional
$102,664
Immigrants | Hungary
98.9
/100
|
#86
Exceptional
$102,655
Immigrants | Western Europe
98.9
/100
|
#87
Exceptional
$102,654
Immigrants | Canada
98.9
/100
|
#88
Exceptional
$102,616
Romanians
98.8
/100
|
#89
Exceptional
$102,544
Ukrainians
98.8
/100
|
#90
Exceptional
$102,451
Croatians
98.7
/100
|
#91
Exceptional
$102,414
Immigrants | North America
98.7
/100
|
#92
Exceptional
$102,407
Immigrants | England
98.4
/100
|
#93
Exceptional
$102,020
Sri Lankans
98.4
/100
|
#94
Exceptional
$101,960
Assyrians/Chaldeans/Syriacs
98.3
/100
|
#95
Exceptional
$101,936
Macedonians
98.3
/100
|
#96
Exceptional
$101,882
Austrians
98.3
/100
|
#97
Exceptional
$101,842
Immigrants | Kazakhstan
98.1
/100
|
#98
Exceptional
$101,727