Black/African American vs Brazilian Median Earnings
COMPARE
Black/African American
Brazilian
Median Earnings
Median Earnings Comparison
Blacks/African Americans
Brazilians
$40,085
MEDIAN EARNINGS
0.0/ 100
METRIC RATING
319th/ 347
METRIC RANK
$48,356
MEDIAN EARNINGS
93.7/ 100
METRIC RATING
124th/ 347
METRIC RANK
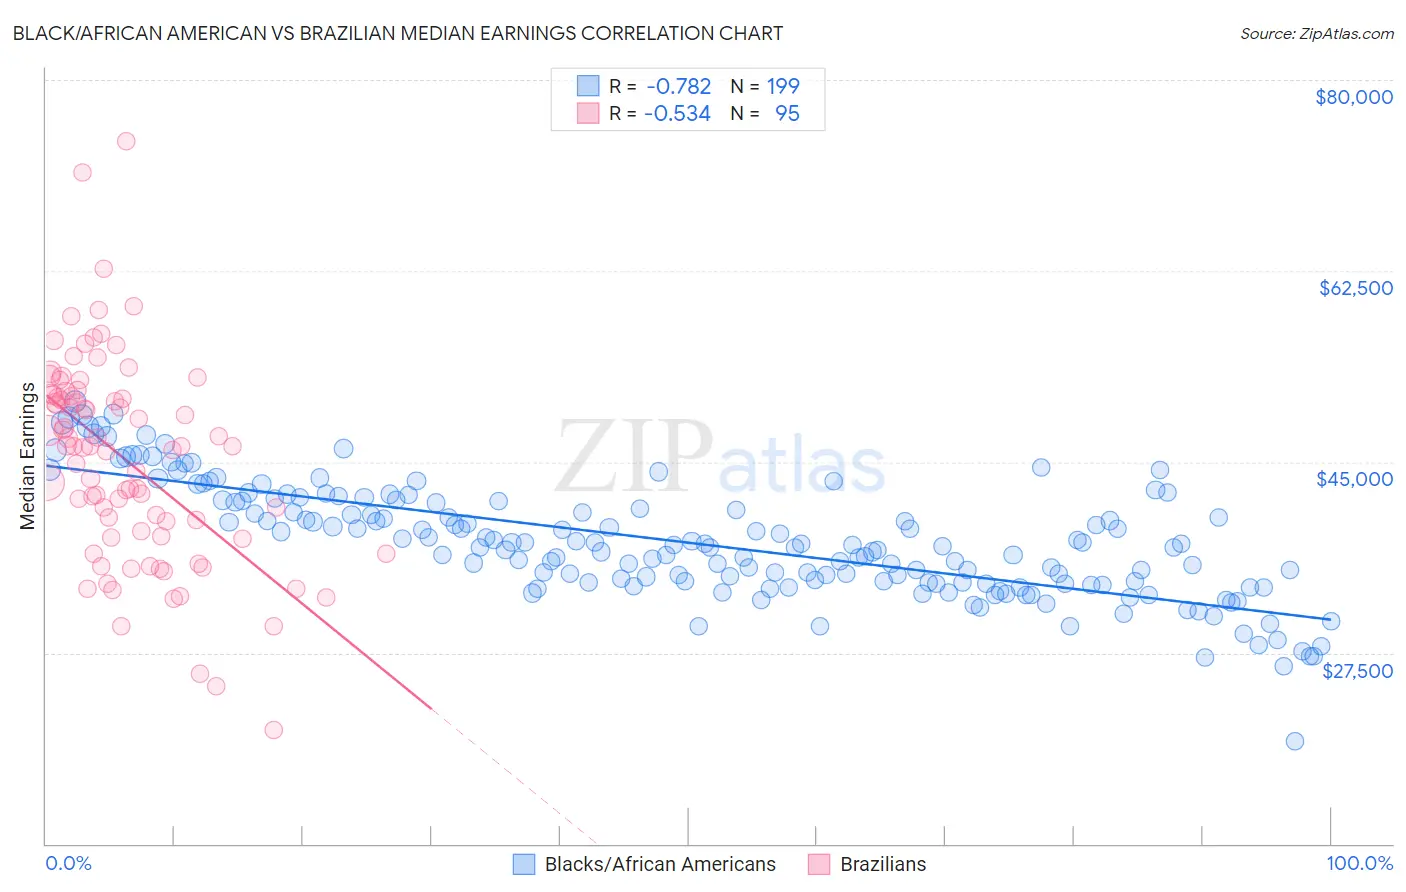
Black/African American vs Brazilian Median Earnings Correlation Chart
The statistical analysis conducted on geographies consisting of 564,527,137 people shows a strong negative correlation between the proportion of Blacks/African Americans and median earnings in the United States with a correlation coefficient (R) of -0.782 and weighted average of $40,085. Similarly, the statistical analysis conducted on geographies consisting of 323,957,574 people shows a substantial negative correlation between the proportion of Brazilians and median earnings in the United States with a correlation coefficient (R) of -0.534 and weighted average of $48,356, a difference of 20.6%.
Median Earnings Correlation Summary
| Measurement | Black/African American | Brazilian |
| Minimum | $19,448 | $20,417 |
| Maximum | $50,539 | $74,375 |
| Range | $31,091 | $53,958 |
| Mean | $37,581 | $45,246 |
| Median | $37,241 | $46,406 |
| Interquartile 25% (IQ1) | $33,915 | $38,216 |
| Interquartile 75% (IQ3) | $41,371 | $51,116 |
| Interquartile Range (IQR) | $7,457 | $12,900 |
| Standard Deviation (Sample) | $5,238 | $9,424 |
| Standard Deviation (Population) | $5,225 | $9,375 |
Similar Demographics by Median Earnings
Demographics Similar to Blacks/African Americans by Median Earnings
In terms of median earnings, the demographic groups most similar to Blacks/African Americans are Dutch West Indian ($40,107, a difference of 0.060%), Immigrants from Honduras ($40,195, a difference of 0.27%), Fijian ($40,193, a difference of 0.27%), Cheyenne ($40,233, a difference of 0.37%), and Seminole ($40,233, a difference of 0.37%).
| Demographics | Rating | Rank | Median Earnings |
| Chippewa | 0.0 /100 | #312 | Tragic $40,287 |
| Choctaw | 0.0 /100 | #313 | Tragic $40,270 |
| Cheyenne | 0.0 /100 | #314 | Tragic $40,233 |
| Seminole | 0.0 /100 | #315 | Tragic $40,233 |
| Immigrants | Honduras | 0.0 /100 | #316 | Tragic $40,195 |
| Fijians | 0.0 /100 | #317 | Tragic $40,193 |
| Dutch West Indians | 0.0 /100 | #318 | Tragic $40,107 |
| Blacks/African Americans | 0.0 /100 | #319 | Tragic $40,085 |
| Immigrants | Bahamas | 0.0 /100 | #320 | Tragic $39,861 |
| Mexicans | 0.0 /100 | #321 | Tragic $39,834 |
| Immigrants | Central America | 0.0 /100 | #322 | Tragic $39,762 |
| Bahamians | 0.0 /100 | #323 | Tragic $39,735 |
| Ottawa | 0.0 /100 | #324 | Tragic $39,721 |
| Creek | 0.0 /100 | #325 | Tragic $39,648 |
| Immigrants | Yemen | 0.0 /100 | #326 | Tragic $39,540 |
Demographics Similar to Brazilians by Median Earnings
In terms of median earnings, the demographic groups most similar to Brazilians are Immigrants from Syria ($48,375, a difference of 0.040%), Immigrants from Fiji ($48,305, a difference of 0.11%), Assyrian/Chaldean/Syriac ($48,304, a difference of 0.11%), Sierra Leonean ($48,286, a difference of 0.15%), and Immigrants from Philippines ($48,266, a difference of 0.19%).
| Demographics | Rating | Rank | Median Earnings |
| Serbians | 95.9 /100 | #117 | Exceptional $48,677 |
| Immigrants | Jordan | 95.9 /100 | #118 | Exceptional $48,673 |
| Poles | 95.8 /100 | #119 | Exceptional $48,659 |
| Carpatho Rusyns | 95.5 /100 | #120 | Exceptional $48,617 |
| Arabs | 95.4 /100 | #121 | Exceptional $48,599 |
| Chileans | 94.8 /100 | #122 | Exceptional $48,504 |
| Immigrants | Syria | 93.9 /100 | #123 | Exceptional $48,375 |
| Brazilians | 93.7 /100 | #124 | Exceptional $48,356 |
| Immigrants | Fiji | 93.3 /100 | #125 | Exceptional $48,305 |
| Assyrians/Chaldeans/Syriacs | 93.3 /100 | #126 | Exceptional $48,304 |
| Sierra Leoneans | 93.1 /100 | #127 | Exceptional $48,286 |
| Immigrants | Philippines | 92.9 /100 | #128 | Exceptional $48,266 |
| Pakistanis | 92.8 /100 | #129 | Exceptional $48,254 |
| Zimbabweans | 92.6 /100 | #130 | Exceptional $48,229 |
| Lebanese | 92.5 /100 | #131 | Exceptional $48,226 |