Blackfeet vs Cambodian Per Capita Income
COMPARE
Blackfeet
Cambodian
Per Capita Income
Per Capita Income Comparison
Blackfeet
Cambodians
$37,695
PER CAPITA INCOME
0.1/ 100
METRIC RATING
288th/ 347
METRIC RANK
$51,731
PER CAPITA INCOME
100.0/ 100
METRIC RATING
39th/ 347
METRIC RANK
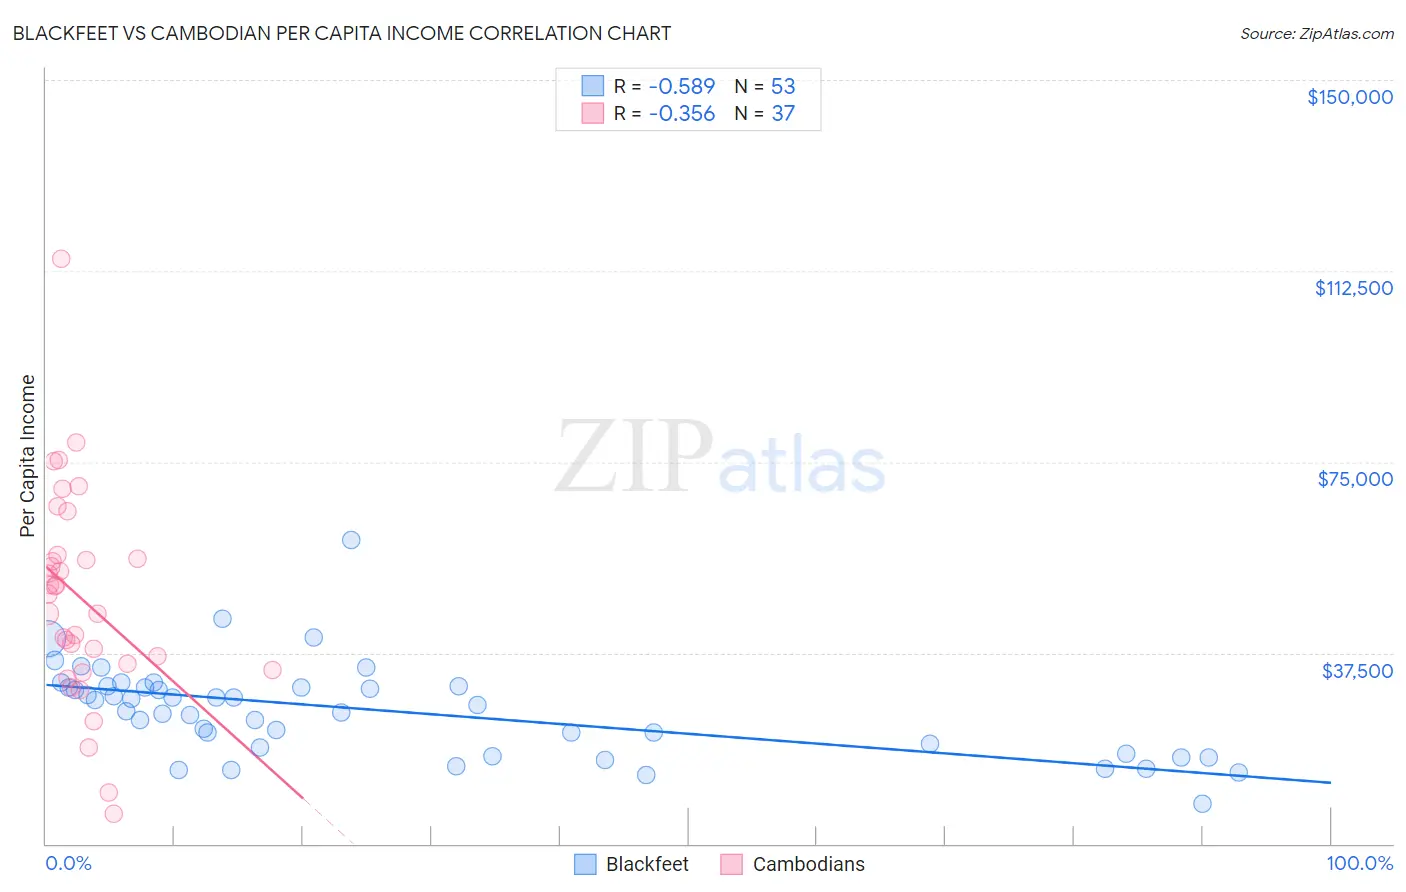
Blackfeet vs Cambodian Per Capita Income Correlation Chart
The statistical analysis conducted on geographies consisting of 309,586,612 people shows a substantial negative correlation between the proportion of Blackfeet and per capita income in the United States with a correlation coefficient (R) of -0.589 and weighted average of $37,695. Similarly, the statistical analysis conducted on geographies consisting of 102,519,941 people shows a mild negative correlation between the proportion of Cambodians and per capita income in the United States with a correlation coefficient (R) of -0.356 and weighted average of $51,731, a difference of 37.2%.
Per Capita Income Correlation Summary
| Measurement | Blackfeet | Cambodian |
| Minimum | $7,946 | $5,866 |
| Maximum | $59,700 | $114,830 |
| Range | $51,754 | $108,964 |
| Mean | $26,182 | $48,227 |
| Median | $27,256 | $49,059 |
| Interquartile 25% (IQ1) | $18,286 | $34,778 |
| Interquartile 75% (IQ3) | $30,810 | $56,350 |
| Interquartile Range (IQR) | $12,524 | $21,571 |
| Standard Deviation (Sample) | $9,146 | $20,684 |
| Standard Deviation (Population) | $9,059 | $20,403 |
Similar Demographics by Per Capita Income
Demographics Similar to Blackfeet by Per Capita Income
In terms of per capita income, the demographic groups most similar to Blackfeet are Dominican ($37,697, a difference of 0.0%), Central American Indian ($37,699, a difference of 0.010%), Guatemalan ($37,766, a difference of 0.19%), African ($37,785, a difference of 0.24%), and U.S. Virgin Islander ($37,589, a difference of 0.28%).
| Demographics | Rating | Rank | Per Capita Income |
| Immigrants | Dominica | 0.2 /100 | #281 | Tragic $37,952 |
| Immigrants | Laos | 0.1 /100 | #282 | Tragic $37,857 |
| Pennsylvania Germans | 0.1 /100 | #283 | Tragic $37,842 |
| Africans | 0.1 /100 | #284 | Tragic $37,785 |
| Guatemalans | 0.1 /100 | #285 | Tragic $37,766 |
| Central American Indians | 0.1 /100 | #286 | Tragic $37,699 |
| Dominicans | 0.1 /100 | #287 | Tragic $37,697 |
| Blackfeet | 0.1 /100 | #288 | Tragic $37,695 |
| U.S. Virgin Islanders | 0.1 /100 | #289 | Tragic $37,589 |
| Immigrants | Guatemala | 0.1 /100 | #290 | Tragic $37,550 |
| Cajuns | 0.1 /100 | #291 | Tragic $37,527 |
| Immigrants | Micronesia | 0.1 /100 | #292 | Tragic $37,464 |
| Mexican American Indians | 0.1 /100 | #293 | Tragic $37,407 |
| Cubans | 0.1 /100 | #294 | Tragic $37,383 |
| Immigrants | Dominican Republic | 0.1 /100 | #295 | Tragic $37,306 |
Demographics Similar to Cambodians by Per Capita Income
In terms of per capita income, the demographic groups most similar to Cambodians are Immigrants from Czechoslovakia ($51,770, a difference of 0.070%), Immigrants from Korea ($51,671, a difference of 0.12%), Estonian ($51,875, a difference of 0.28%), Immigrants from Greece ($51,891, a difference of 0.31%), and Immigrants from South Africa ($51,465, a difference of 0.52%).
| Demographics | Rating | Rank | Per Capita Income |
| Immigrants | Norway | 100.0 /100 | #32 | Exceptional $52,217 |
| Australians | 100.0 /100 | #33 | Exceptional $52,074 |
| Immigrants | Russia | 100.0 /100 | #34 | Exceptional $52,044 |
| Burmese | 100.0 /100 | #35 | Exceptional $52,005 |
| Immigrants | Greece | 100.0 /100 | #36 | Exceptional $51,891 |
| Estonians | 100.0 /100 | #37 | Exceptional $51,875 |
| Immigrants | Czechoslovakia | 100.0 /100 | #38 | Exceptional $51,770 |
| Cambodians | 100.0 /100 | #39 | Exceptional $51,731 |
| Immigrants | Korea | 100.0 /100 | #40 | Exceptional $51,671 |
| Immigrants | South Africa | 100.0 /100 | #41 | Exceptional $51,465 |
| Immigrants | Turkey | 100.0 /100 | #42 | Exceptional $51,368 |
| Immigrants | Lithuania | 100.0 /100 | #43 | Exceptional $51,361 |
| Immigrants | Europe | 100.0 /100 | #44 | Exceptional $50,950 |
| Immigrants | Spain | 100.0 /100 | #45 | Exceptional $50,933 |
| Immigrants | Latvia | 100.0 /100 | #46 | Exceptional $50,914 |