Bhutanese vs Samoan Median Household Income

COMPARE

Bhutanese
Race
Ancestry
AfghanAfricanAlaska NativeAlaskan AthabascanAlbanianAleutAlsatianAmericanApacheArabArapahoArgentineanArmenianAssyrian/Chaldean/SyriacAustralianAustrianBahamianBangladeshiBarbadianBasqueBelgianBelizeanBermudanBhutaneseBlackfeetBolivianBrazilianBritishBritish West IndianBulgarianBurmeseCajunCambodianCanadianCape VerdeanCarpatho RusynCelticCentral AmericanCentral American IndianCherokeeCheyenneChickasawChileanChineseChippewaChoctawColombianColvilleComancheCosta RicanCreeCreekCroatianCrowCubanCypriotCzechCzechoslovakianDanishDelawareDominicanDutchDutch West IndianEastern EuropeanEcuadorianEgyptianEnglishEstonianEthiopianEuropeanFijianFilipinoFinnishFrenchFrench American IndianFrench CanadianGermanGerman RussianGhanaianGreekGuamanian/ChamorroGuatemalanGuyaneseHaitianHmongHonduranHopiHoumaHungarianIcelanderIndian (Asian)IndonesianInupiatIranianIraqiIrishIroquoisIsraeliItalianJamaicanJapaneseJordanianKenyanKiowaKoreanLaotianLatvianLebaneseLiberianLithuanianLumbeeLuxembourgerMacedonianMalaysianMalteseMarshalleseMenomineeMexicanMexican American IndianMongolianMoroccanNative HawaiianNavajoNepaleseNew ZealanderNicaraguanNigerianNorthern EuropeanNorwegianOkinawanOsageOttawaPaiutePakistaniPalestinianPanamanianParaguayanPennsylvania GermanPeruvianPimaPolishPortuguesePotawatomiPuebloPuerto RicanPuget Sound SalishRomanianRussianSalvadoranScandinavianScotch-IrishScottishSeminoleSenegaleseSerbianShoshoneSierra LeoneanSiouxSlavicSlovakSloveneSomaliSouth AfricanSouth AmericanSouth American IndianSoviet UnionSpaniardSpanishSpanish AmericanSpanish American IndianSri LankanSubsaharan AfricanSudaneseSwedishSwissSyrianTaiwaneseThaiTlingit-HaidaTohono O'OdhamTonganTrinidadian and TobagonianTsimshianTurkishU.S. Virgin IslanderUgandanUkrainianUruguayanUteVenezuelanVietnameseWelshWest IndianYakamaYaquiYugoslavianYumanYup'ikZimbabwean
Immigration
NonimmigrantsImmigrantsAfghanistanAfricaAlbaniaArgentinaArmeniaAsiaAustraliaAustriaBahamasBangladeshBarbadosBelarusBelgiumBelizeBoliviaBosnia and HerzegovinaBrazilBulgariaBurma/MyanmarCabo VerdeCambodiaCameroonCanadaCaribbeanCentral AmericaChileChinaColombiaCongoCosta RicaCroatiaCubaCzechoslovakiaDenmarkDominicaDominican RepublicEastern AfricaEastern AsiaEastern EuropeEcuadorEgyptEl SalvadorEnglandEritreaEthiopiaEuropeFijiFranceGermanyGhanaGreeceGrenadaGuatemalaGuyanaHaitiHondurasHong KongHungaryIndiaIndonesiaIranIraqIrelandIsraelItalyJamaicaJapanJordanKazakhstanKenyaKoreaKuwaitLaosLatin AmericaLatviaLebanonLiberiaLithuaniaMalaysiaMexicoMicronesiaMiddle AfricaMoldovaMoroccoNepalNetherlandsNicaraguaNigeriaNorth AmericaNorth MacedoniaNorthern AfricaNorthern EuropeNorwayOceaniaPakistanPanamaPeruPhilippinesPolandPortugalRomaniaRussiaSaudi ArabiaScotlandSenegalSerbiaSierra LeoneSingaporeSomaliaSouth AfricaSouth AmericaSouth Central AsiaSouth Eastern AsiaSouthern EuropeSpainSri LankaSt. Vincent and the GrenadinesSudanSwedenSwitzerlandSyriaTaiwanThailandTrinidad and TobagoTurkeyUgandaUkraineUruguayUzbekistanVenezuelaVietnamWest IndiesWestern AfricaWestern AsiaWestern EuropeYemenZaireZimbabweAzores
Samoan
Race
Ancestry
AfghanAfricanAlaska NativeAlaskan AthabascanAlbanianAleutAlsatianAmericanApacheArabArapahoArgentineanArmenianAssyrian/Chaldean/SyriacAustralianAustrianBahamianBangladeshiBarbadianBasqueBelgianBelizeanBermudanBlackfeetBolivianBrazilianBritishBritish West IndianBulgarianBurmeseCajunCambodianCanadianCape VerdeanCarpatho RusynCelticCentral AmericanCentral American IndianCherokeeCheyenneChickasawChileanChineseChippewaChoctawColombianColvilleComancheCosta RicanCreeCreekCroatianCrowCubanCypriotCzechCzechoslovakianDanishDelawareDominicanDutchDutch West IndianEastern EuropeanEcuadorianEgyptianEnglishEstonianEthiopianEuropeanFijianFilipinoFinnishFrenchFrench American IndianFrench CanadianGermanGerman RussianGhanaianGreekGuamanian/ChamorroGuatemalanGuyaneseHaitianHmongHonduranHopiHoumaHungarianIcelanderIndian (Asian)IndonesianInupiatIranianIraqiIrishIroquoisIsraeliItalianJamaicanJapaneseJordanianKenyanKiowaKoreanLaotianLatvianLebaneseLiberianLithuanianLumbeeLuxembourgerMacedonianMalaysianMalteseMarshalleseMenomineeMexicanMexican American IndianMongolianMoroccanNative HawaiianNavajoNepaleseNew ZealanderNicaraguanNigerianNorthern EuropeanNorwegianOkinawanOsageOttawaPaiutePakistaniPalestinianPanamanianParaguayanPennsylvania GermanPeruvianPimaPolishPortuguesePotawatomiPuebloPuerto RicanPuget Sound SalishRomanianRussianSalvadoranSamoanScandinavianScotch-IrishScottishSeminoleSenegaleseSerbianShoshoneSierra LeoneanSiouxSlavicSlovakSloveneSomaliSouth AfricanSouth AmericanSouth American IndianSoviet UnionSpaniardSpanishSpanish AmericanSpanish American IndianSri LankanSubsaharan AfricanSudaneseSwedishSwissSyrianTaiwaneseThaiTlingit-HaidaTohono O'OdhamTonganTrinidadian and TobagonianTsimshianTurkishU.S. Virgin IslanderUgandanUkrainianUruguayanUteVenezuelanVietnameseWelshWest IndianYakamaYaquiYugoslavianYumanYup'ikZimbabwean
Immigration
NonimmigrantsImmigrantsAfghanistanAfricaAlbaniaArgentinaArmeniaAsiaAustraliaAustriaBahamasBangladeshBarbadosBelarusBelgiumBelizeBoliviaBosnia and HerzegovinaBrazilBulgariaBurma/MyanmarCabo VerdeCambodiaCameroonCanadaCaribbeanCentral AmericaChileChinaColombiaCongoCosta RicaCroatiaCubaCzechoslovakiaDenmarkDominicaDominican RepublicEastern AfricaEastern AsiaEastern EuropeEcuadorEgyptEl SalvadorEnglandEritreaEthiopiaEuropeFijiFranceGermanyGhanaGreeceGrenadaGuatemalaGuyanaHaitiHondurasHong KongHungaryIndiaIndonesiaIranIraqIrelandIsraelItalyJamaicaJapanJordanKazakhstanKenyaKoreaKuwaitLaosLatin AmericaLatviaLebanonLiberiaLithuaniaMalaysiaMexicoMicronesiaMiddle AfricaMoldovaMoroccoNepalNetherlandsNicaraguaNigeriaNorth AmericaNorth MacedoniaNorthern AfricaNorthern EuropeNorwayOceaniaPakistanPanamaPeruPhilippinesPolandPortugalRomaniaRussiaSaudi ArabiaScotlandSenegalSerbiaSierra LeoneSingaporeSomaliaSouth AfricaSouth AmericaSouth Central AsiaSouth Eastern AsiaSouthern EuropeSpainSri LankaSt. Vincent and the GrenadinesSudanSwedenSwitzerlandSyriaTaiwanThailandTrinidad and TobagoTurkeyUgandaUkraineUruguayUzbekistanVenezuelaVietnamWest IndiesWestern AfricaWestern AsiaWestern EuropeYemenZaireZimbabweAzores
Median Household Income
Income
Poverty
Unemployment
Labor Participation
Family Structure
Vehicle Availability
Education Level
Disability

Median Household Income Comparison

Bhutanese

Samoans

Exceptional
Good
$100,151
MEDIAN HOUSEHOLD INCOME
100.0/ 100
METRIC RATING
27th/ 347
METRIC RANK
$86,498
MEDIAN HOUSEHOLD INCOME
71.0/ 100
METRIC RATING
157th/ 347
METRIC RANK

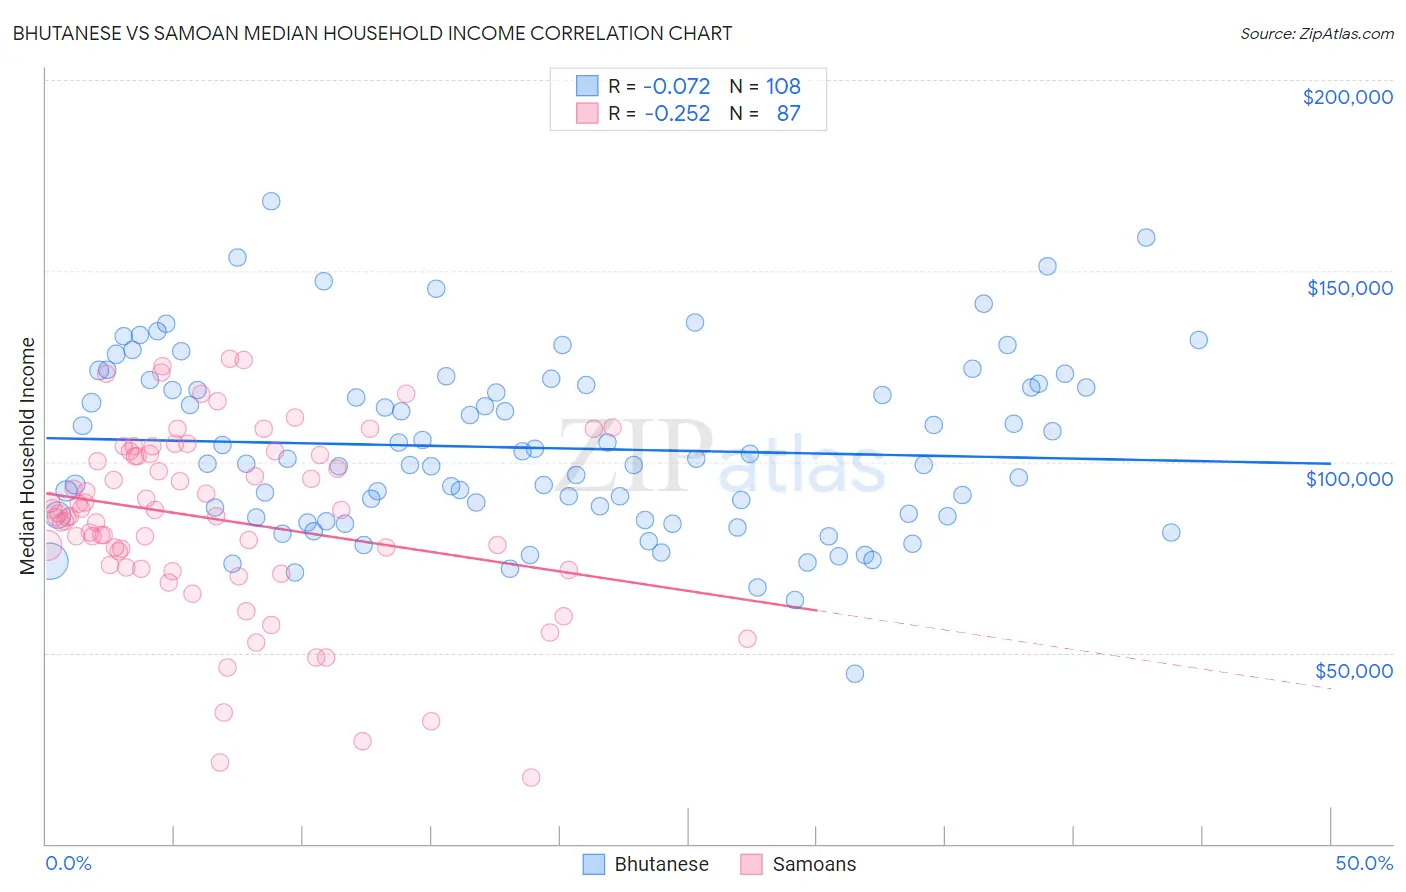
Bhutanese vs Samoan Median Household Income Correlation Chart

The statistical analysis conducted on geographies consisting of 455,036,820 people shows a slight negative correlation between the proportion of Bhutanese and median household income in the United States with a correlation coefficient (R) of -0.072 and weighted average of $100,151. Similarly, the statistical analysis conducted on geographies consisting of 225,063,012 people shows a weak negative correlation between the proportion of Samoans and median household income in the United States with a correlation coefficient (R) of -0.252 and weighted average of $86,498, a difference of 15.8%.
Bhutanese vs Samoan Median Household Income

Median Household Income Correlation Summary

MeasurementBhutaneseSamoan
Minimum$44,611$17,452
Maximum$168,247$127,143
Range$123,636$109,691
Mean$103,677$84,959
Median$100,131$86,491
Interquartile 25% (IQ1)$85,552$72,428
Interquartile 75% (IQ3)$119,777$101,996
Interquartile Range (IQR)$34,225$29,568
Standard Deviation (Sample)$23,044$23,715
Standard Deviation (Population)$22,937$23,578

Similar Demographics by Median Household Income

Demographics Similar to Bhutanese by Median Household Income

In terms of median household income, the demographic groups most similar to Bhutanese are Immigrants from Belgium ($100,306, a difference of 0.15%), Immigrants from Sri Lanka ($99,943, a difference of 0.21%), Immigrants from Asia ($99,933, a difference of 0.22%), Immigrants from Northern Europe ($99,813, a difference of 0.34%), and Immigrants from Sweden ($100,699, a difference of 0.55%).
DemographicsRating | RankMedian Household Income
Bolivians
100.0
/100
|
#20
Exceptional
$102,195
Eastern Europeans
100.0
/100
|
#21
Exceptional
$101,781
Asians
100.0
/100
|
#22
Exceptional
$101,681
Immigrants | Bolivia
100.0
/100
|
#23
Exceptional
$101,394
Immigrants | Japan
100.0
/100
|
#24
Exceptional
$100,711
Immigrants | Sweden
100.0
/100
|
#25
Exceptional
$100,699
Immigrants | Belgium
100.0
/100
|
#26
Exceptional
$100,306
Bhutanese
100.0
/100
|
#27
Exceptional
$100,151
Immigrants | Sri Lanka
100.0
/100
|
#28
Exceptional
$99,943
Immigrants | Asia
100.0
/100
|
#29
Exceptional
$99,933
Immigrants | Northern Europe
100.0
/100
|
#30
Exceptional
$99,813
Turks
100.0
/100
|
#31
Exceptional
$99,389
Immigrants | Denmark
100.0
/100
|
#32
Exceptional
$98,510
Chinese
100.0
/100
|
#33
Exceptional
$98,496
Russians
100.0
/100
|
#34
Exceptional
$98,008

Demographics Similar to Samoans by Median Household Income

In terms of median household income, the demographic groups most similar to Samoans are Immigrants from Albania ($86,534, a difference of 0.040%), Moroccan ($86,468, a difference of 0.040%), Immigrants from Uzbekistan ($86,425, a difference of 0.080%), Luxembourger ($86,418, a difference of 0.090%), and Slavic ($86,398, a difference of 0.12%).
DemographicsRating | RankMedian Household Income
Basques
77.2
/100
|
#150
Good
$87,001
Hungarians
76.3
/100
|
#151
Good
$86,920
Immigrants | Saudi Arabia
75.8
/100
|
#152
Good
$86,875
South Americans
75.1
/100
|
#153
Good
$86,824
Immigrants | Germany
74.4
/100
|
#154
Good
$86,764
Carpatho Rusyns
72.8
/100
|
#155
Good
$86,635
Immigrants | Albania
71.5
/100
|
#156
Good
$86,534
Samoans
71.0
/100
|
#157
Good
$86,498
Moroccans
70.6
/100
|
#158
Good
$86,468
Immigrants | Uzbekistan
70.1
/100
|
#159
Good
$86,425
Luxembourgers
70.0
/100
|
#160
Good
$86,418
Slavs
69.7
/100
|
#161
Good
$86,398
Guamanians/Chamorros
67.7
/100
|
#162
Good
$86,255
Czechs
66.4
/100
|
#163
Good
$86,164
Irish
66.2
/100
|
#164
Good
$86,145