Bermudan vs Thai Median Earnings
COMPARE
Bermudan
Thai
Median Earnings
Median Earnings Comparison
Bermudans
Thais
$45,593
MEDIAN EARNINGS
23.5/ 100
METRIC RATING
212th/ 347
METRIC RANK
$59,237
MEDIAN EARNINGS
100.0/ 100
METRIC RATING
5th/ 347
METRIC RANK
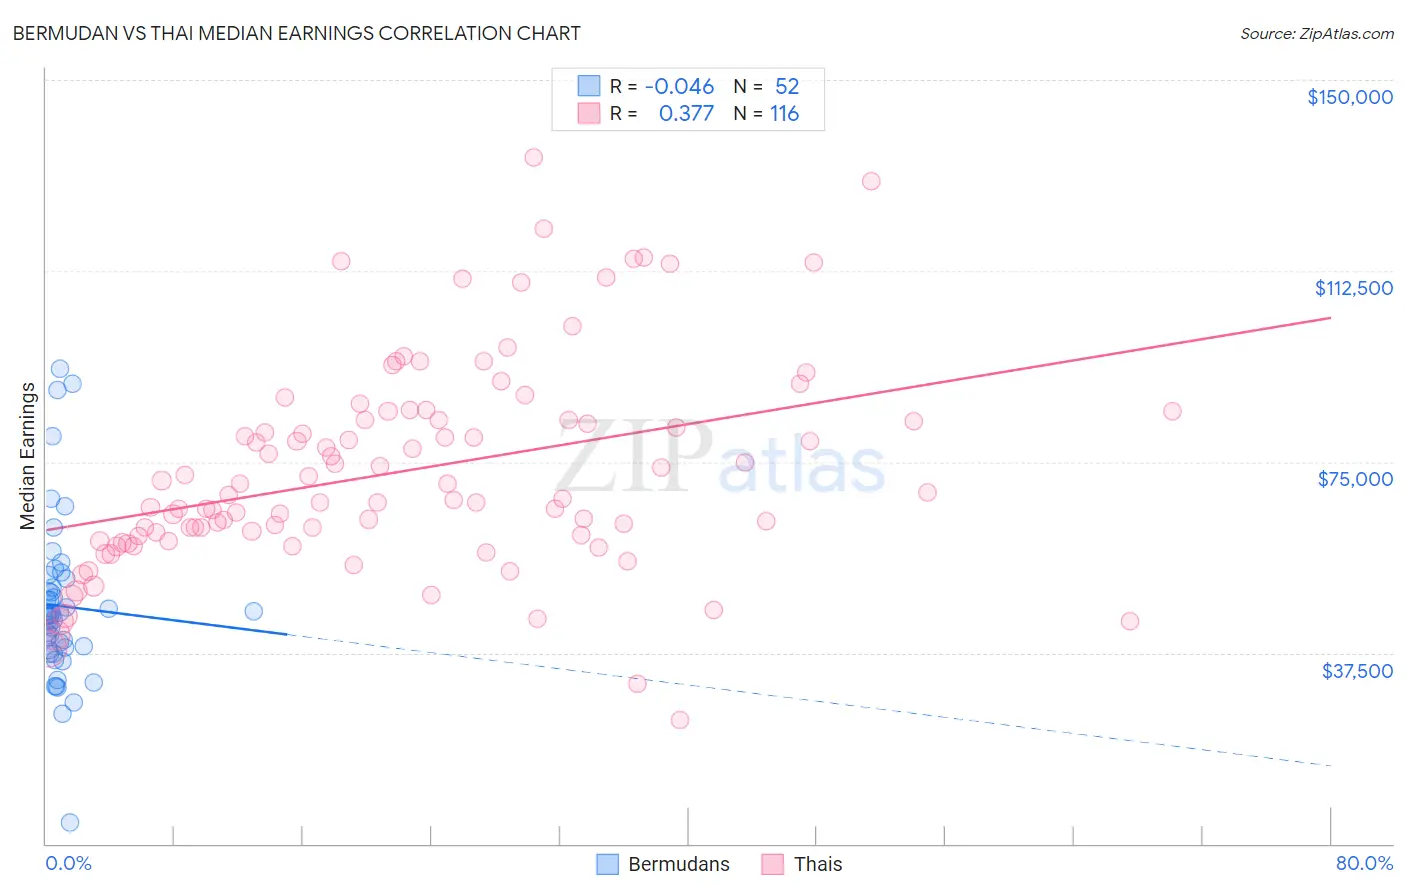
Bermudan vs Thai Median Earnings Correlation Chart
The statistical analysis conducted on geographies consisting of 55,730,379 people shows no correlation between the proportion of Bermudans and median earnings in the United States with a correlation coefficient (R) of -0.046 and weighted average of $45,593. Similarly, the statistical analysis conducted on geographies consisting of 475,851,474 people shows a mild positive correlation between the proportion of Thais and median earnings in the United States with a correlation coefficient (R) of 0.377 and weighted average of $59,237, a difference of 29.9%.
Median Earnings Correlation Summary
| Measurement | Bermudan | Thai |
| Minimum | $4,250 | $24,353 |
| Maximum | $93,350 | $134,793 |
| Range | $89,100 | $110,440 |
| Mean | $46,670 | $73,089 |
| Median | $44,943 | $68,147 |
| Interquartile 25% (IQ1) | $38,258 | $59,963 |
| Interquartile 75% (IQ3) | $51,130 | $83,196 |
| Interquartile Range (IQR) | $12,872 | $23,232 |
| Standard Deviation (Sample) | $16,028 | $20,568 |
| Standard Deviation (Population) | $15,873 | $20,479 |
Similar Demographics by Median Earnings
Demographics Similar to Bermudans by Median Earnings
In terms of median earnings, the demographic groups most similar to Bermudans are Panamanian ($45,593, a difference of 0.0%), Immigrants from Bosnia and Herzegovina ($45,600, a difference of 0.010%), Immigrants from Thailand ($45,598, a difference of 0.010%), Immigrants from Grenada ($45,596, a difference of 0.010%), and Immigrants from Senegal ($45,611, a difference of 0.040%).
| Demographics | Rating | Rank | Median Earnings |
| Tongans | 25.4 /100 | #205 | Fair $45,665 |
| Immigrants | Ghana | 24.8 /100 | #206 | Fair $45,641 |
| Immigrants | Senegal | 24.0 /100 | #207 | Fair $45,611 |
| Immigrants | Bosnia and Herzegovina | 23.7 /100 | #208 | Fair $45,600 |
| Immigrants | Thailand | 23.7 /100 | #209 | Fair $45,598 |
| Immigrants | Grenada | 23.6 /100 | #210 | Fair $45,596 |
| Panamanians | 23.5 /100 | #211 | Fair $45,593 |
| Bermudans | 23.5 /100 | #212 | Fair $45,593 |
| Immigrants | Colombia | 22.4 /100 | #213 | Fair $45,550 |
| Nigerians | 22.0 /100 | #214 | Fair $45,532 |
| Immigrants | Bangladesh | 22.0 /100 | #215 | Fair $45,532 |
| Guyanese | 20.6 /100 | #216 | Fair $45,470 |
| Tlingit-Haida | 20.5 /100 | #217 | Fair $45,468 |
| Spanish | 19.7 /100 | #218 | Poor $45,432 |
| Dutch | 18.4 /100 | #219 | Poor $45,370 |
Demographics Similar to Thais by Median Earnings
In terms of median earnings, the demographic groups most similar to Thais are Immigrants from Hong Kong ($59,433, a difference of 0.33%), Immigrants from Singapore ($59,038, a difference of 0.34%), Iranian ($58,474, a difference of 1.3%), Immigrants from India ($60,648, a difference of 2.4%), and Immigrants from Iran ($57,612, a difference of 2.8%).
| Demographics | Rating | Rank | Median Earnings |
| Filipinos | 100.0 /100 | #1 | Exceptional $61,197 |
| Immigrants | Taiwan | 100.0 /100 | #2 | Exceptional $61,151 |
| Immigrants | India | 100.0 /100 | #3 | Exceptional $60,648 |
| Immigrants | Hong Kong | 100.0 /100 | #4 | Exceptional $59,433 |
| Thais | 100.0 /100 | #5 | Exceptional $59,237 |
| Immigrants | Singapore | 100.0 /100 | #6 | Exceptional $59,038 |
| Iranians | 100.0 /100 | #7 | Exceptional $58,474 |
| Immigrants | Iran | 100.0 /100 | #8 | Exceptional $57,612 |
| Okinawans | 100.0 /100 | #9 | Exceptional $57,550 |
| Immigrants | South Central Asia | 100.0 /100 | #10 | Exceptional $57,114 |
| Immigrants | Israel | 100.0 /100 | #11 | Exceptional $57,034 |
| Immigrants | Ireland | 100.0 /100 | #12 | Exceptional $56,854 |
| Immigrants | China | 100.0 /100 | #13 | Exceptional $56,638 |
| Immigrants | Australia | 100.0 /100 | #14 | Exceptional $56,305 |
| Indians (Asian) | 100.0 /100 | #15 | Exceptional $56,253 |