Belizean vs White/Caucasian Median Earnings
COMPARE
Belizean
White/Caucasian
Median Earnings
Median Earnings Comparison
Belizeans
Whites/Caucasians
$42,702
MEDIAN EARNINGS
0.5/ 100
METRIC RATING
269th/ 347
METRIC RANK
$45,197
MEDIAN EARNINGS
15.0/ 100
METRIC RATING
223rd/ 347
METRIC RANK
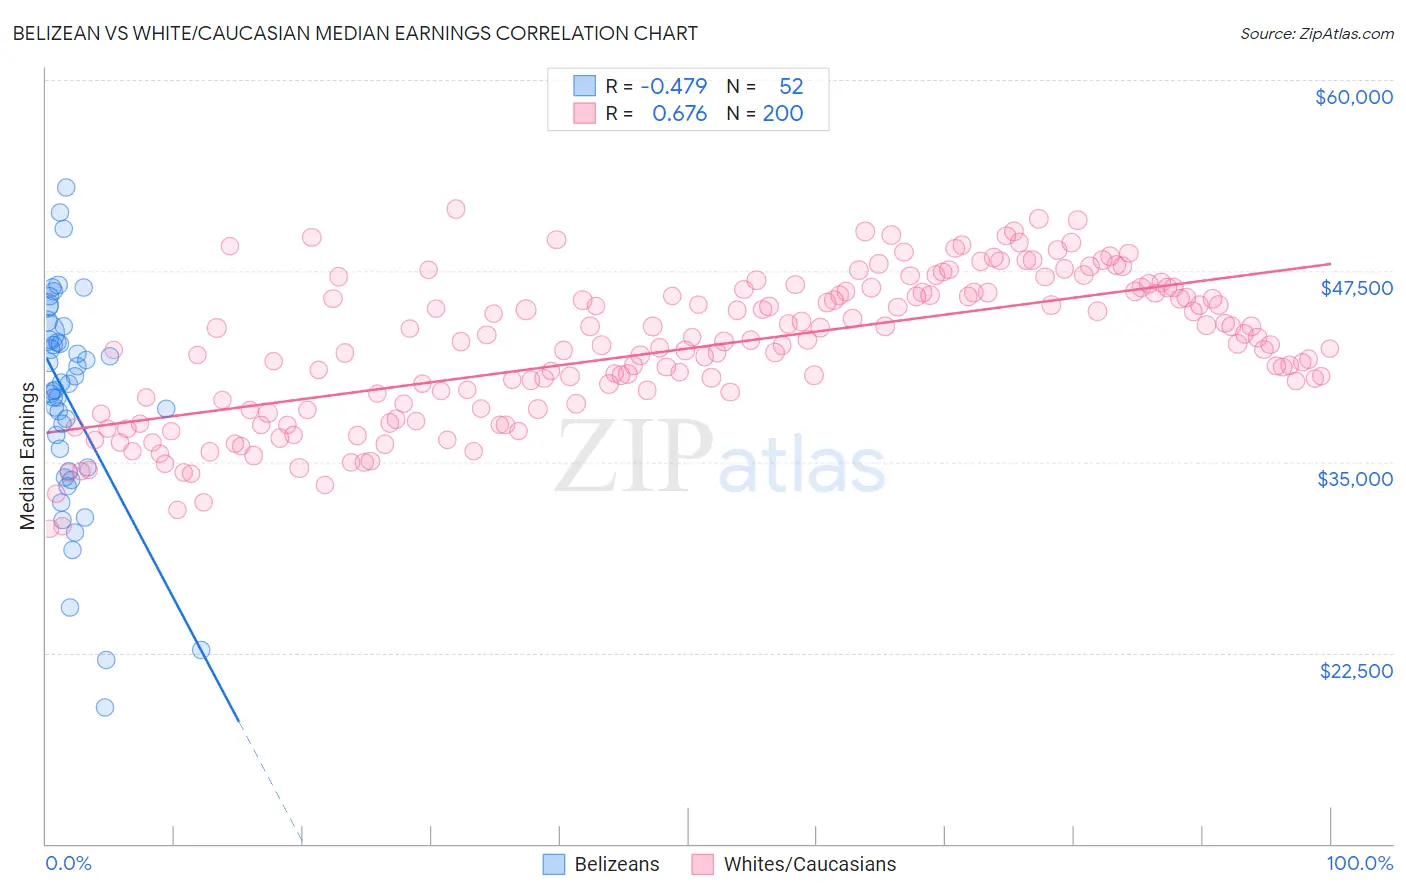
Belizean vs White/Caucasian Median Earnings Correlation Chart
The statistical analysis conducted on geographies consisting of 144,215,704 people shows a moderate negative correlation between the proportion of Belizeans and median earnings in the United States with a correlation coefficient (R) of -0.479 and weighted average of $42,702. Similarly, the statistical analysis conducted on geographies consisting of 584,189,858 people shows a significant positive correlation between the proportion of Whites/Caucasians and median earnings in the United States with a correlation coefficient (R) of 0.676 and weighted average of $45,197, a difference of 5.8%.
Median Earnings Correlation Summary
| Measurement | Belizean | White/Caucasian |
| Minimum | $18,932 | $30,625 |
| Maximum | $52,967 | $51,538 |
| Range | $34,035 | $20,913 |
| Mean | $38,949 | $42,432 |
| Median | $39,910 | $42,807 |
| Interquartile 25% (IQ1) | $34,513 | $38,641 |
| Interquartile 75% (IQ3) | $43,245 | $46,089 |
| Interquartile Range (IQR) | $8,732 | $7,448 |
| Standard Deviation (Sample) | $7,165 | $4,733 |
| Standard Deviation (Population) | $7,096 | $4,721 |
Similar Demographics by Median Earnings
Demographics Similar to Belizeans by Median Earnings
In terms of median earnings, the demographic groups most similar to Belizeans are American ($42,742, a difference of 0.090%), Osage ($42,651, a difference of 0.12%), Cree ($42,777, a difference of 0.17%), Pennsylvania German ($42,615, a difference of 0.21%), and Immigrants from Laos ($42,884, a difference of 0.43%).
| Demographics | Rating | Rank | Median Earnings |
| Nicaraguans | 0.8 /100 | #262 | Tragic $43,026 |
| Inupiat | 0.8 /100 | #263 | Tragic $43,000 |
| Immigrants | Liberia | 0.7 /100 | #264 | Tragic $42,923 |
| Salvadorans | 0.7 /100 | #265 | Tragic $42,912 |
| Immigrants | Laos | 0.7 /100 | #266 | Tragic $42,884 |
| Cree | 0.6 /100 | #267 | Tragic $42,777 |
| Americans | 0.6 /100 | #268 | Tragic $42,742 |
| Belizeans | 0.5 /100 | #269 | Tragic $42,702 |
| Osage | 0.5 /100 | #270 | Tragic $42,651 |
| Pennsylvania Germans | 0.5 /100 | #271 | Tragic $42,615 |
| Iroquois | 0.4 /100 | #272 | Tragic $42,430 |
| Immigrants | Dominica | 0.4 /100 | #273 | Tragic $42,420 |
| Immigrants | El Salvador | 0.4 /100 | #274 | Tragic $42,413 |
| Immigrants | Belize | 0.3 /100 | #275 | Tragic $42,339 |
| Spanish Americans | 0.3 /100 | #276 | Tragic $42,316 |
Demographics Similar to Whites/Caucasians by Median Earnings
In terms of median earnings, the demographic groups most similar to Whites/Caucasians are Immigrants from Panama ($45,198, a difference of 0.0%), Immigrants from Guyana ($45,204, a difference of 0.020%), Ecuadorian ($45,214, a difference of 0.040%), West Indian ($45,132, a difference of 0.15%), and Immigrants from Cambodia ($45,090, a difference of 0.24%).
| Demographics | Rating | Rank | Median Earnings |
| Guyanese | 20.6 /100 | #216 | Fair $45,470 |
| Tlingit-Haida | 20.5 /100 | #217 | Fair $45,468 |
| Spanish | 19.7 /100 | #218 | Poor $45,432 |
| Dutch | 18.4 /100 | #219 | Poor $45,370 |
| Ecuadorians | 15.3 /100 | #220 | Poor $45,214 |
| Immigrants | Guyana | 15.1 /100 | #221 | Poor $45,204 |
| Immigrants | Panama | 15.0 /100 | #222 | Poor $45,198 |
| Whites/Caucasians | 15.0 /100 | #223 | Poor $45,197 |
| West Indians | 13.9 /100 | #224 | Poor $45,132 |
| Immigrants | Cambodia | 13.2 /100 | #225 | Poor $45,090 |
| Immigrants | Nigeria | 12.2 /100 | #226 | Poor $45,030 |
| Native Hawaiians | 12.2 /100 | #227 | Poor $45,027 |
| Immigrants | Iraq | 11.6 /100 | #228 | Poor $44,988 |
| Scotch-Irish | 10.7 /100 | #229 | Poor $44,924 |
| Immigrants | Western Africa | 10.3 /100 | #230 | Poor $44,893 |