Belizean vs Slovene Median Female Earnings
COMPARE
Belizean
Slovene
Median Female Earnings
Median Female Earnings Comparison
Belizeans
Slovenes
$37,429
MEDIAN FEMALE EARNINGS
0.9/ 100
METRIC RATING
258th/ 347
METRIC RANK
$39,817
MEDIAN FEMALE EARNINGS
56.2/ 100
METRIC RATING
170th/ 347
METRIC RANK
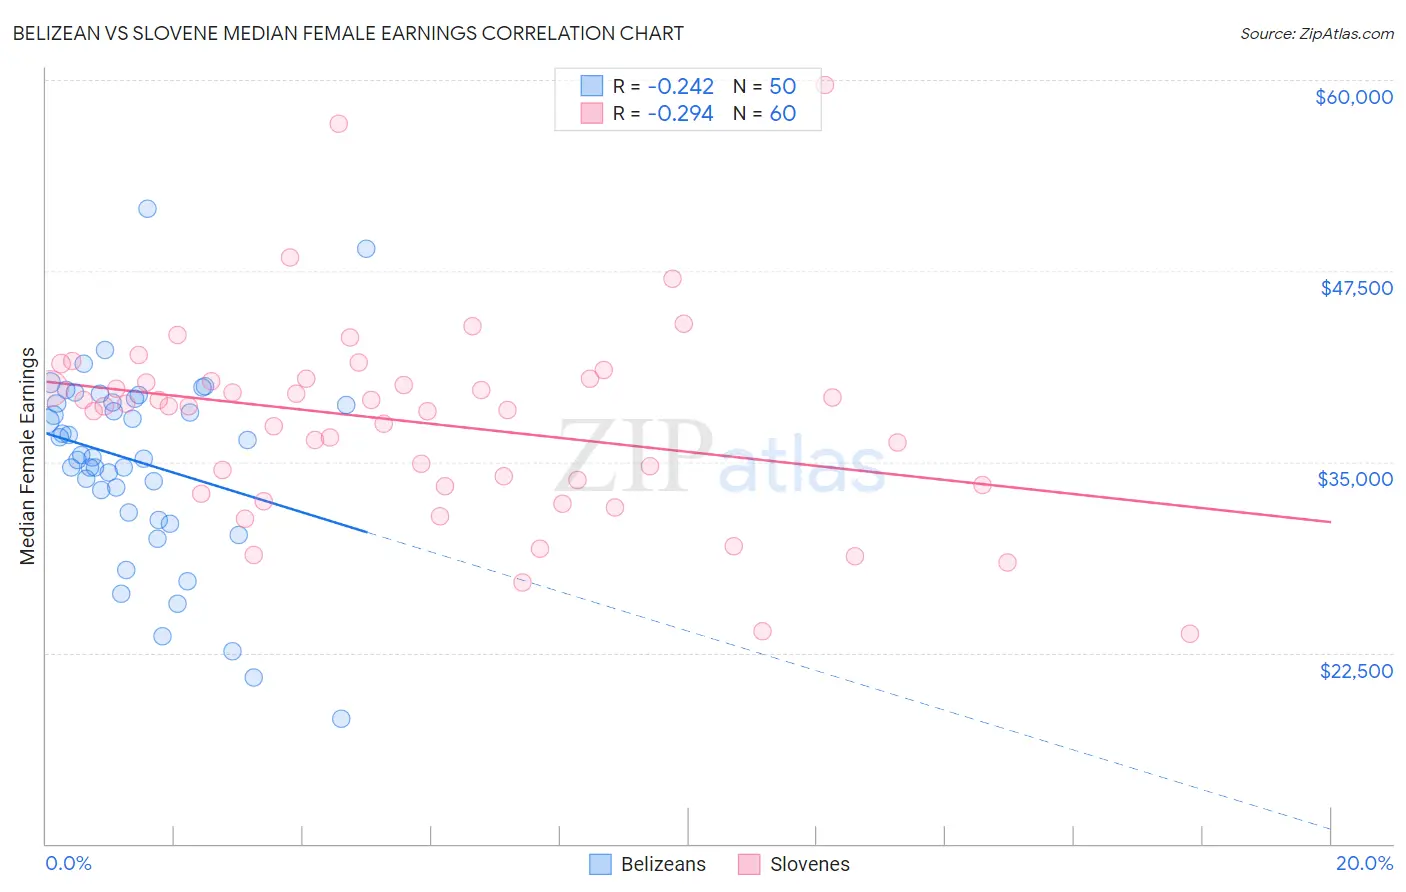
Belizean vs Slovene Median Female Earnings Correlation Chart
The statistical analysis conducted on geographies consisting of 144,203,712 people shows a weak negative correlation between the proportion of Belizeans and median female earnings in the United States with a correlation coefficient (R) of -0.242 and weighted average of $37,429. Similarly, the statistical analysis conducted on geographies consisting of 261,275,001 people shows a weak negative correlation between the proportion of Slovenes and median female earnings in the United States with a correlation coefficient (R) of -0.294 and weighted average of $39,817, a difference of 6.4%.
Median Female Earnings Correlation Summary
| Measurement | Belizean | Slovene |
| Minimum | $18,201 | $23,750 |
| Maximum | $51,565 | $59,643 |
| Range | $33,364 | $35,893 |
| Mean | $34,988 | $37,579 |
| Median | $35,337 | $38,639 |
| Interquartile 25% (IQ1) | $31,707 | $33,473 |
| Interquartile 75% (IQ3) | $38,920 | $40,326 |
| Interquartile Range (IQR) | $7,213 | $6,853 |
| Standard Deviation (Sample) | $6,353 | $6,516 |
| Standard Deviation (Population) | $6,289 | $6,461 |
Similar Demographics by Median Female Earnings
Demographics Similar to Belizeans by Median Female Earnings
In terms of median female earnings, the demographic groups most similar to Belizeans are Scotch-Irish ($37,383, a difference of 0.12%), Hawaiian ($37,497, a difference of 0.18%), Samoan ($37,498, a difference of 0.19%), Colville ($37,514, a difference of 0.23%), and Dutch ($37,339, a difference of 0.24%).
| Demographics | Rating | Rank | Median Female Earnings |
| Welsh | 2.1 /100 | #251 | Tragic $37,856 |
| Immigrants | Dominica | 2.0 /100 | #252 | Tragic $37,825 |
| Danes | 1.6 /100 | #253 | Tragic $37,730 |
| Whites/Caucasians | 1.1 /100 | #254 | Tragic $37,531 |
| Colville | 1.1 /100 | #255 | Tragic $37,514 |
| Samoans | 1.0 /100 | #256 | Tragic $37,498 |
| Hawaiians | 1.0 /100 | #257 | Tragic $37,497 |
| Belizeans | 0.9 /100 | #258 | Tragic $37,429 |
| Scotch-Irish | 0.8 /100 | #259 | Tragic $37,383 |
| Dutch | 0.7 /100 | #260 | Tragic $37,339 |
| Malaysians | 0.7 /100 | #261 | Tragic $37,298 |
| Venezuelans | 0.7 /100 | #262 | Tragic $37,282 |
| German Russians | 0.5 /100 | #263 | Tragic $37,105 |
| Salvadorans | 0.4 /100 | #264 | Tragic $37,083 |
| Immigrants | Belize | 0.4 /100 | #265 | Tragic $37,056 |
Demographics Similar to Slovenes by Median Female Earnings
In terms of median female earnings, the demographic groups most similar to Slovenes are Immigrants from Portugal ($39,788, a difference of 0.070%), Kenyan ($39,860, a difference of 0.11%), British ($39,772, a difference of 0.11%), Immigrants from Peru ($39,871, a difference of 0.13%), and Immigrants from Ghana ($39,894, a difference of 0.19%).
| Demographics | Rating | Rank | Median Female Earnings |
| Lebanese | 65.5 /100 | #163 | Good $40,006 |
| Immigrants | Saudi Arabia | 62.9 /100 | #164 | Good $39,952 |
| Immigrants | Bangladesh | 60.8 /100 | #165 | Good $39,910 |
| Immigrants | Ghana | 60.0 /100 | #166 | Good $39,894 |
| Luxembourgers | 59.9 /100 | #167 | Average $39,891 |
| Immigrants | Peru | 58.9 /100 | #168 | Average $39,871 |
| Kenyans | 58.4 /100 | #169 | Average $39,860 |
| Slovenes | 56.2 /100 | #170 | Average $39,817 |
| Immigrants | Portugal | 54.7 /100 | #171 | Average $39,788 |
| British | 53.8 /100 | #172 | Average $39,772 |
| Canadians | 51.4 /100 | #173 | Average $39,724 |
| South Americans | 50.0 /100 | #174 | Average $39,698 |
| Immigrants | South America | 47.2 /100 | #175 | Average $39,643 |
| Nigerians | 47.0 /100 | #176 | Average $39,641 |
| Costa Ricans | 46.1 /100 | #177 | Average $39,622 |