Belizean vs Immigrants from Pakistan Median Family Income
COMPARE
Belizean
Immigrants from Pakistan
Median Family Income
Median Family Income Comparison
Belizeans
Immigrants from Pakistan
$90,880
MEDIAN FAMILY INCOME
0.2/ 100
METRIC RATING
269th/ 347
METRIC RANK
$114,406
MEDIAN FAMILY INCOME
99.8/ 100
METRIC RATING
63rd/ 347
METRIC RANK
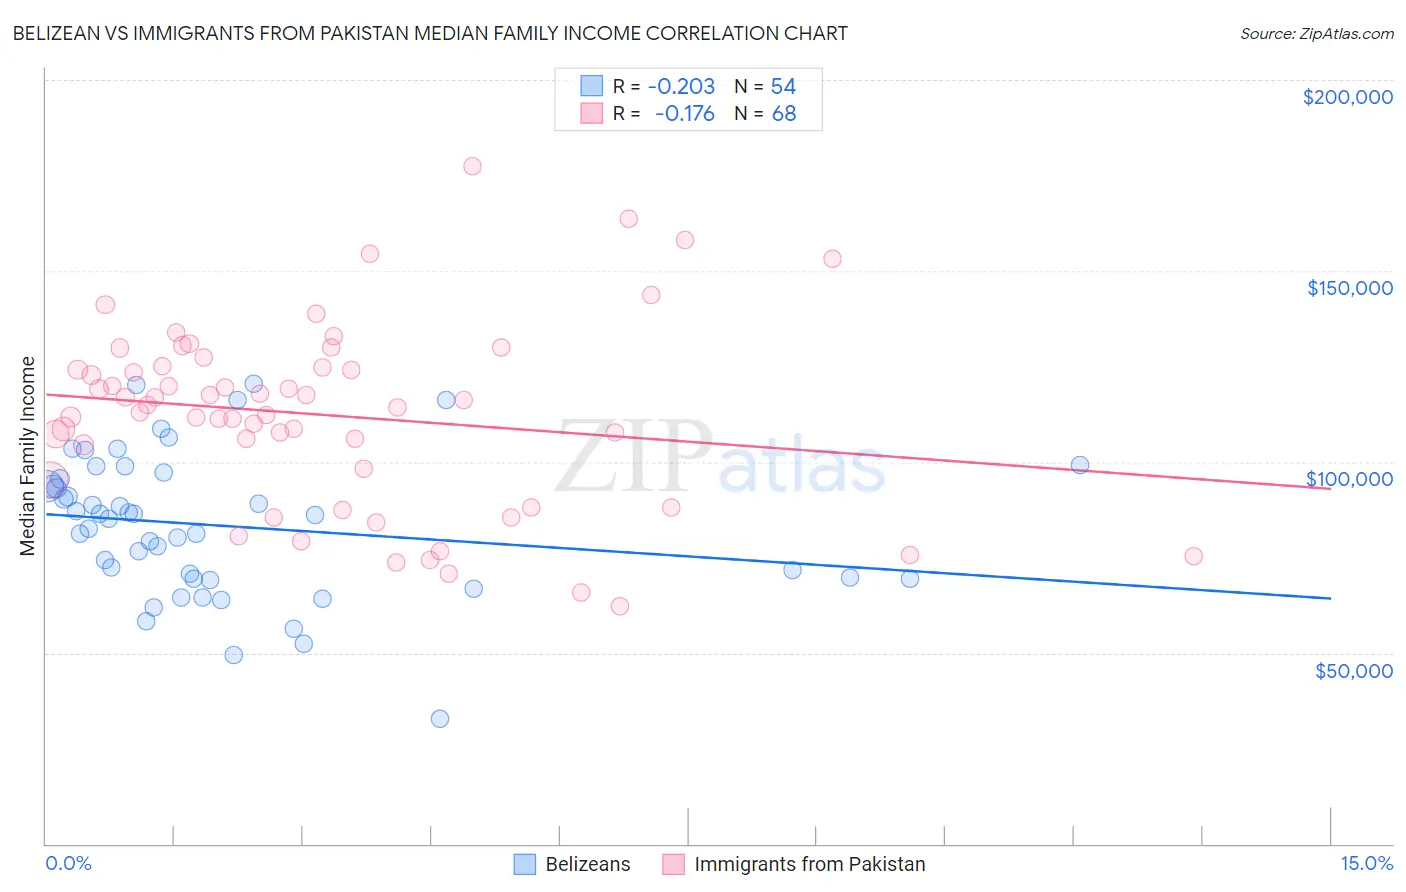
Belizean vs Immigrants from Pakistan Median Family Income Correlation Chart
The statistical analysis conducted on geographies consisting of 144,140,604 people shows a weak negative correlation between the proportion of Belizeans and median family income in the United States with a correlation coefficient (R) of -0.203 and weighted average of $90,880. Similarly, the statistical analysis conducted on geographies consisting of 283,715,977 people shows a poor negative correlation between the proportion of Immigrants from Pakistan and median family income in the United States with a correlation coefficient (R) of -0.176 and weighted average of $114,406, a difference of 25.9%.
Median Family Income Correlation Summary
| Measurement | Belizean | Immigrants from Pakistan |
| Minimum | $32,813 | $62,310 |
| Maximum | $120,348 | $177,453 |
| Range | $87,535 | $115,143 |
| Mean | $83,217 | $112,240 |
| Median | $85,583 | $114,706 |
| Interquartile 25% (IQ1) | $69,412 | $96,673 |
| Interquartile 75% (IQ3) | $95,563 | $124,867 |
| Interquartile Range (IQR) | $26,151 | $28,194 |
| Standard Deviation (Sample) | $18,683 | $24,169 |
| Standard Deviation (Population) | $18,509 | $23,991 |
Similar Demographics by Median Family Income
Demographics Similar to Belizeans by Median Family Income
In terms of median family income, the demographic groups most similar to Belizeans are Cree ($90,882, a difference of 0.0%), Mexican American Indian ($90,918, a difference of 0.040%), Central American ($91,087, a difference of 0.23%), Jamaican ($90,581, a difference of 0.33%), and Iroquois ($90,543, a difference of 0.37%).
| Demographics | Rating | Rank | Median Family Income |
| Liberians | 0.4 /100 | #262 | Tragic $91,722 |
| Immigrants | West Indies | 0.3 /100 | #263 | Tragic $91,588 |
| Senegalese | 0.3 /100 | #264 | Tragic $91,475 |
| Hmong | 0.3 /100 | #265 | Tragic $91,296 |
| Central Americans | 0.3 /100 | #266 | Tragic $91,087 |
| Mexican American Indians | 0.2 /100 | #267 | Tragic $90,918 |
| Cree | 0.2 /100 | #268 | Tragic $90,882 |
| Belizeans | 0.2 /100 | #269 | Tragic $90,880 |
| Jamaicans | 0.2 /100 | #270 | Tragic $90,581 |
| Iroquois | 0.2 /100 | #271 | Tragic $90,543 |
| Immigrants | Liberia | 0.2 /100 | #272 | Tragic $90,450 |
| Immigrants | Micronesia | 0.2 /100 | #273 | Tragic $90,345 |
| Spanish Americans | 0.2 /100 | #274 | Tragic $90,322 |
| Immigrants | St. Vincent and the Grenadines | 0.2 /100 | #275 | Tragic $90,094 |
| Immigrants | Zaire | 0.1 /100 | #276 | Tragic $89,285 |
Demographics Similar to Immigrants from Pakistan by Median Family Income
In terms of median family income, the demographic groups most similar to Immigrants from Pakistan are Immigrants from Scotland ($114,392, a difference of 0.010%), Mongolian ($114,553, a difference of 0.13%), Immigrants from Belarus ($114,586, a difference of 0.16%), Egyptian ($114,119, a difference of 0.25%), and Paraguayan ($114,016, a difference of 0.34%).
| Demographics | Rating | Rank | Median Family Income |
| New Zealanders | 99.8 /100 | #56 | Exceptional $115,230 |
| Greeks | 99.8 /100 | #57 | Exceptional $115,192 |
| Immigrants | Indonesia | 99.8 /100 | #58 | Exceptional $115,162 |
| Immigrants | Netherlands | 99.8 /100 | #59 | Exceptional $114,987 |
| Immigrants | Latvia | 99.8 /100 | #60 | Exceptional $114,826 |
| Immigrants | Belarus | 99.8 /100 | #61 | Exceptional $114,586 |
| Mongolians | 99.8 /100 | #62 | Exceptional $114,553 |
| Immigrants | Pakistan | 99.8 /100 | #63 | Exceptional $114,406 |
| Immigrants | Scotland | 99.7 /100 | #64 | Exceptional $114,392 |
| Egyptians | 99.7 /100 | #65 | Exceptional $114,119 |
| Paraguayans | 99.7 /100 | #66 | Exceptional $114,016 |
| Immigrants | Spain | 99.7 /100 | #67 | Exceptional $113,815 |
| Immigrants | Serbia | 99.6 /100 | #68 | Exceptional $113,463 |
| Immigrants | Bulgaria | 99.6 /100 | #69 | Exceptional $113,461 |
| Immigrants | Romania | 99.6 /100 | #70 | Exceptional $113,434 |