Belizean vs Immigrants from Albania Householder Income Under 25 years
COMPARE
Belizean
Immigrants from Albania
Householder Income Under 25 years
Householder Income Under 25 years Comparison
Belizeans
Immigrants from Albania
$51,094
HOUSEHOLDER INCOME UNDER 25 YEARS
6.4/ 100
METRIC RATING
224th/ 347
METRIC RANK
$53,597
HOUSEHOLDER INCOME UNDER 25 YEARS
96.9/ 100
METRIC RATING
115th/ 347
METRIC RANK
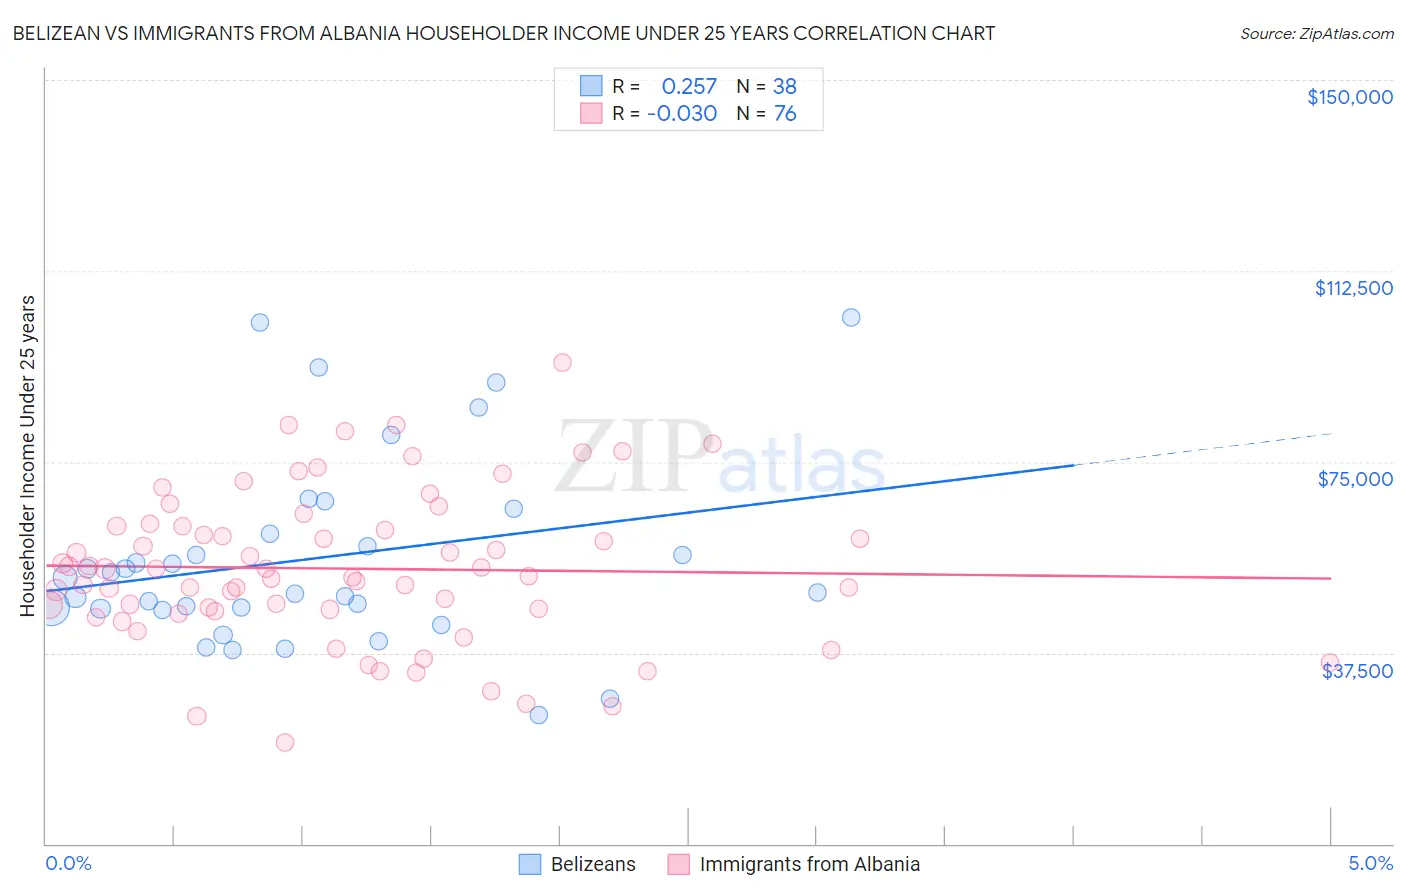
Belizean vs Immigrants from Albania Householder Income Under 25 years Correlation Chart
The statistical analysis conducted on geographies consisting of 132,883,097 people shows a weak positive correlation between the proportion of Belizeans and household income with householder under the age of 25 in the United States with a correlation coefficient (R) of 0.257 and weighted average of $51,094. Similarly, the statistical analysis conducted on geographies consisting of 107,044,611 people shows no correlation between the proportion of Immigrants from Albania and household income with householder under the age of 25 in the United States with a correlation coefficient (R) of -0.030 and weighted average of $53,597, a difference of 4.9%.
Householder Income Under 25 years Correlation Summary
| Measurement | Belizean | Immigrants from Albania |
| Minimum | $25,260 | $19,811 |
| Maximum | $103,333 | $94,545 |
| Range | $78,073 | $74,734 |
| Mean | $55,975 | $54,041 |
| Median | $50,853 | $53,274 |
| Interquartile 25% (IQ1) | $46,192 | $45,869 |
| Interquartile 75% (IQ3) | $60,909 | $62,406 |
| Interquartile Range (IQR) | $14,716 | $16,537 |
| Standard Deviation (Sample) | $18,766 | $14,993 |
| Standard Deviation (Population) | $18,517 | $14,894 |
Similar Demographics by Householder Income Under 25 years
Demographics Similar to Belizeans by Householder Income Under 25 years
In terms of householder income under 25 years, the demographic groups most similar to Belizeans are Serbian ($51,106, a difference of 0.020%), Spaniard ($51,117, a difference of 0.050%), Immigrants from Jamaica ($51,038, a difference of 0.11%), Immigrants from Eastern Africa ($51,158, a difference of 0.13%), and Yugoslavian ($51,028, a difference of 0.13%).
| Demographics | Rating | Rank | Householder Income Under 25 years |
| Czechoslovakians | 8.6 /100 | #217 | Tragic $51,224 |
| Immigrants | Belize | 8.6 /100 | #218 | Tragic $51,223 |
| Arabs | 8.5 /100 | #219 | Tragic $51,219 |
| Immigrants | Germany | 8.0 /100 | #220 | Tragic $51,190 |
| Immigrants | Eastern Africa | 7.4 /100 | #221 | Tragic $51,158 |
| Spaniards | 6.8 /100 | #222 | Tragic $51,117 |
| Serbians | 6.6 /100 | #223 | Tragic $51,106 |
| Belizeans | 6.4 /100 | #224 | Tragic $51,094 |
| Immigrants | Jamaica | 5.6 /100 | #225 | Tragic $51,038 |
| Yugoslavians | 5.5 /100 | #226 | Tragic $51,028 |
| Immigrants | Central America | 5.4 /100 | #227 | Tragic $51,022 |
| Immigrants | Norway | 5.0 /100 | #228 | Tragic $50,984 |
| Yuman | 4.4 /100 | #229 | Tragic $50,933 |
| Jamaicans | 4.4 /100 | #230 | Tragic $50,929 |
| Ugandans | 4.3 /100 | #231 | Tragic $50,923 |
Demographics Similar to Immigrants from Albania by Householder Income Under 25 years
In terms of householder income under 25 years, the demographic groups most similar to Immigrants from Albania are Immigrants from Sweden ($53,621, a difference of 0.040%), Romanian ($53,632, a difference of 0.070%), Immigrants from Spain ($53,560, a difference of 0.070%), Lithuanian ($53,552, a difference of 0.080%), and Immigrants from Switzerland ($53,528, a difference of 0.13%).
| Demographics | Rating | Rank | Householder Income Under 25 years |
| Maltese | 97.8 /100 | #108 | Exceptional $53,735 |
| Immigrants | Ecuador | 97.7 /100 | #109 | Exceptional $53,722 |
| Greeks | 97.7 /100 | #110 | Exceptional $53,715 |
| Immigrants | Colombia | 97.7 /100 | #111 | Exceptional $53,714 |
| Immigrants | Oceania | 97.5 /100 | #112 | Exceptional $53,680 |
| Romanians | 97.2 /100 | #113 | Exceptional $53,632 |
| Immigrants | Sweden | 97.1 /100 | #114 | Exceptional $53,621 |
| Immigrants | Albania | 96.9 /100 | #115 | Exceptional $53,597 |
| Immigrants | Spain | 96.6 /100 | #116 | Exceptional $53,560 |
| Lithuanians | 96.6 /100 | #117 | Exceptional $53,552 |
| Immigrants | Switzerland | 96.3 /100 | #118 | Exceptional $53,528 |
| Italians | 95.4 /100 | #119 | Exceptional $53,426 |
| Guamanians/Chamorros | 95.3 /100 | #120 | Exceptional $53,423 |
| Immigrants | Canada | 95.2 /100 | #121 | Exceptional $53,411 |
| Immigrants | Ethiopia | 95.2 /100 | #122 | Exceptional $53,408 |