Belgian vs Immigrants from El Salvador Median Female Earnings
COMPARE
Belgian
Immigrants from El Salvador
Median Female Earnings
Median Female Earnings Comparison
Belgians
Immigrants from El Salvador
$38,382
MEDIAN FEMALE EARNINGS
6.1/ 100
METRIC RATING
229th/ 347
METRIC RANK
$36,673
MEDIAN FEMALE EARNINGS
0.2/ 100
METRIC RATING
274th/ 347
METRIC RANK
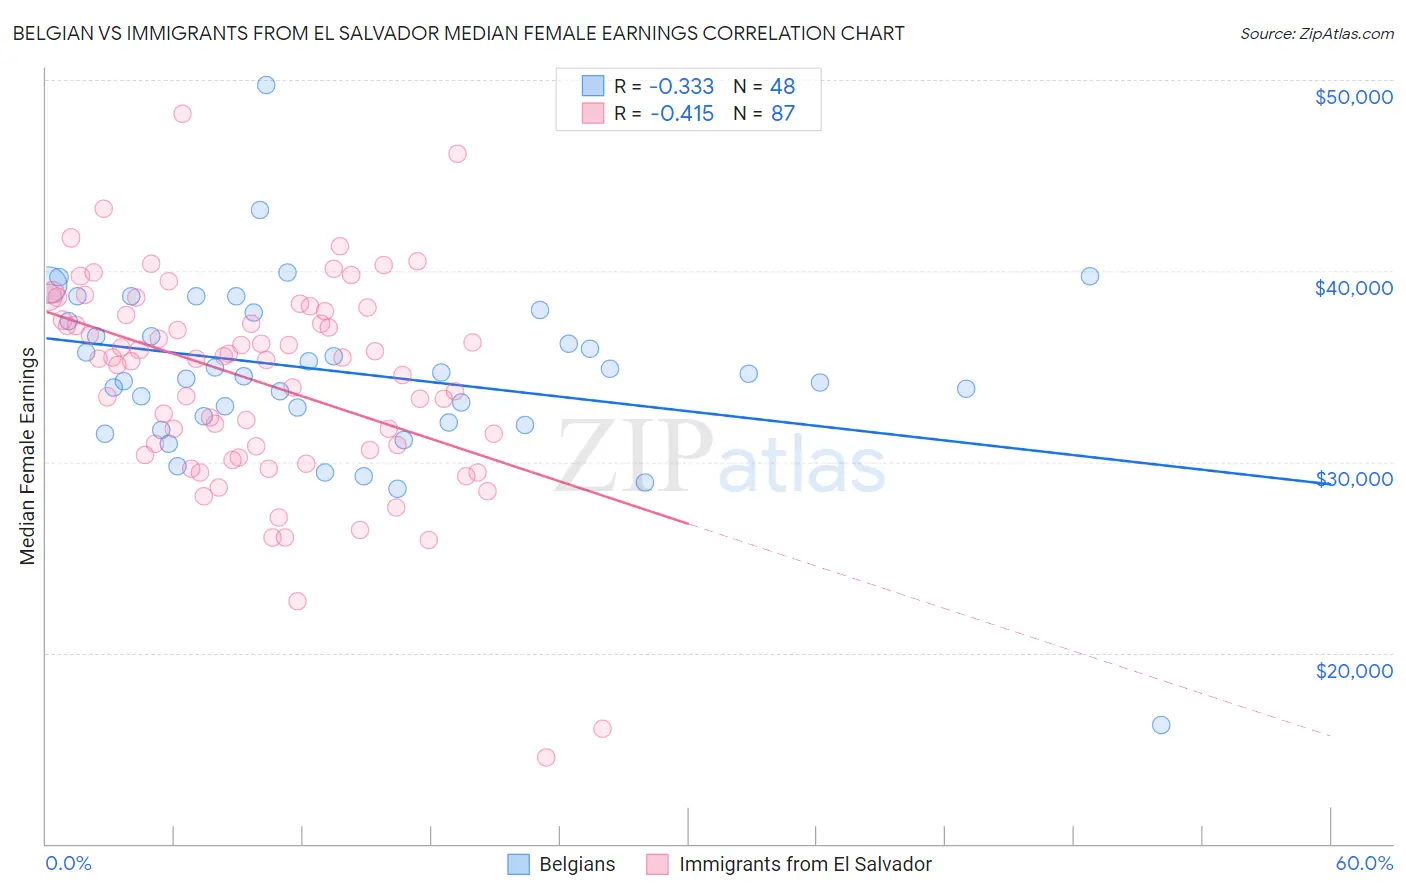
Belgian vs Immigrants from El Salvador Median Female Earnings Correlation Chart
The statistical analysis conducted on geographies consisting of 355,862,311 people shows a mild negative correlation between the proportion of Belgians and median female earnings in the United States with a correlation coefficient (R) of -0.333 and weighted average of $38,382. Similarly, the statistical analysis conducted on geographies consisting of 357,700,398 people shows a moderate negative correlation between the proportion of Immigrants from El Salvador and median female earnings in the United States with a correlation coefficient (R) of -0.415 and weighted average of $36,673, a difference of 4.7%.
Median Female Earnings Correlation Summary
| Measurement | Belgian | Immigrants from El Salvador |
| Minimum | $16,250 | $14,546 |
| Maximum | $49,724 | $48,246 |
| Range | $33,474 | $33,701 |
| Mean | $34,687 | $34,218 |
| Median | $34,563 | $35,415 |
| Interquartile 25% (IQ1) | $32,227 | $30,625 |
| Interquartile 75% (IQ3) | $37,577 | $37,872 |
| Interquartile Range (IQR) | $5,350 | $7,247 |
| Standard Deviation (Sample) | $4,773 | $5,551 |
| Standard Deviation (Population) | $4,723 | $5,519 |
Similar Demographics by Median Female Earnings
Demographics Similar to Belgians by Median Female Earnings
In terms of median female earnings, the demographic groups most similar to Belgians are Subsaharan African ($38,391, a difference of 0.020%), Scottish ($38,397, a difference of 0.040%), Basque ($38,352, a difference of 0.080%), Somali ($38,333, a difference of 0.13%), and French Canadian ($38,436, a difference of 0.14%).
| Demographics | Rating | Rank | Median Female Earnings |
| Japanese | 8.1 /100 | #222 | Tragic $38,528 |
| Immigrants | Sudan | 7.8 /100 | #223 | Tragic $38,511 |
| Native Hawaiians | 7.1 /100 | #224 | Tragic $38,461 |
| French | 7.0 /100 | #225 | Tragic $38,457 |
| French Canadians | 6.8 /100 | #226 | Tragic $38,436 |
| Scottish | 6.3 /100 | #227 | Tragic $38,397 |
| Sub-Saharan Africans | 6.2 /100 | #228 | Tragic $38,391 |
| Belgians | 6.1 /100 | #229 | Tragic $38,382 |
| Basques | 5.7 /100 | #230 | Tragic $38,352 |
| Somalis | 5.5 /100 | #231 | Tragic $38,333 |
| Scandinavians | 5.2 /100 | #232 | Tragic $38,306 |
| Tongans | 5.1 /100 | #233 | Tragic $38,288 |
| Celtics | 5.0 /100 | #234 | Tragic $38,283 |
| Sudanese | 4.4 /100 | #235 | Tragic $38,215 |
| Liberians | 4.4 /100 | #236 | Tragic $38,215 |
Demographics Similar to Immigrants from El Salvador by Median Female Earnings
In terms of median female earnings, the demographic groups most similar to Immigrants from El Salvador are African ($36,530, a difference of 0.39%), Immigrants from Laos ($36,841, a difference of 0.46%), Central American ($36,492, a difference of 0.49%), Immigrants from Dominican Republic ($36,857, a difference of 0.50%), and Marshallese ($36,459, a difference of 0.59%).
| Demographics | Rating | Rank | Median Female Earnings |
| Immigrants | Nonimmigrants | 0.4 /100 | #267 | Tragic $37,024 |
| Cree | 0.4 /100 | #268 | Tragic $37,018 |
| Immigrants | Venezuela | 0.4 /100 | #269 | Tragic $37,003 |
| French American Indians | 0.3 /100 | #270 | Tragic $36,920 |
| Nicaraguans | 0.3 /100 | #271 | Tragic $36,904 |
| Immigrants | Dominican Republic | 0.3 /100 | #272 | Tragic $36,857 |
| Immigrants | Laos | 0.3 /100 | #273 | Tragic $36,841 |
| Immigrants | El Salvador | 0.2 /100 | #274 | Tragic $36,673 |
| Africans | 0.1 /100 | #275 | Tragic $36,530 |
| Central Americans | 0.1 /100 | #276 | Tragic $36,492 |
| Marshallese | 0.1 /100 | #277 | Tragic $36,459 |
| U.S. Virgin Islanders | 0.1 /100 | #278 | Tragic $36,424 |
| Immigrants | Caribbean | 0.1 /100 | #279 | Tragic $36,414 |
| Iroquois | 0.1 /100 | #280 | Tragic $36,408 |
| Spanish Americans | 0.1 /100 | #281 | Tragic $36,391 |