Belgian vs Immigrants from Eastern Africa Median Household Income
COMPARE
Belgian
Immigrants from Eastern Africa
Median Household Income
Median Household Income Comparison
Belgians
Immigrants from Eastern Africa
$84,008
MEDIAN HOUSEHOLD INCOME
33.2/ 100
METRIC RATING
187th/ 347
METRIC RANK
$84,299
MEDIAN HOUSEHOLD INCOME
37.4/ 100
METRIC RATING
184th/ 347
METRIC RANK
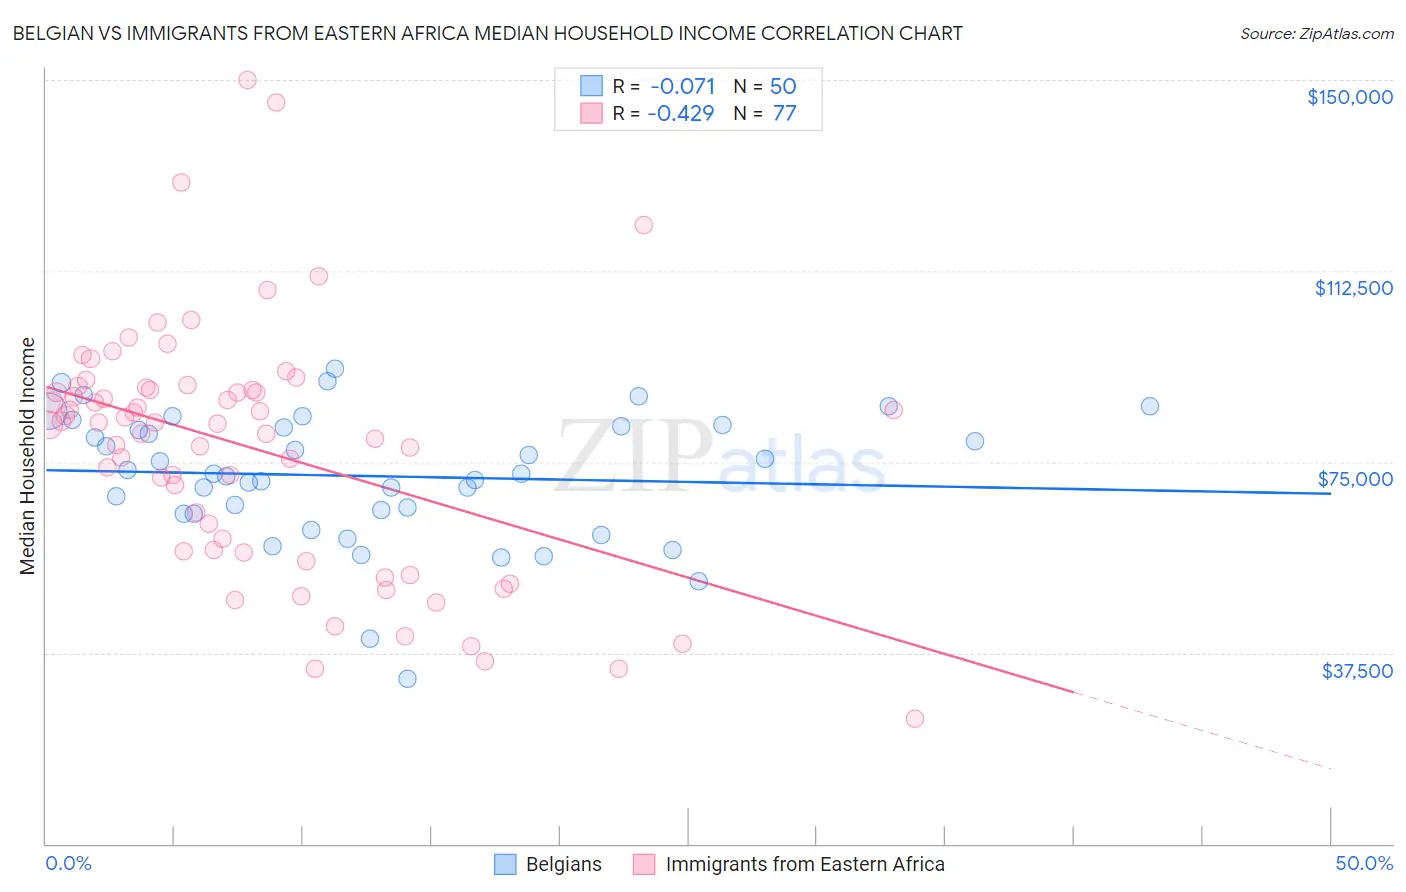
Belgian vs Immigrants from Eastern Africa Median Household Income Correlation Chart
The statistical analysis conducted on geographies consisting of 355,773,334 people shows a slight negative correlation between the proportion of Belgians and median household income in the United States with a correlation coefficient (R) of -0.071 and weighted average of $84,008. Similarly, the statistical analysis conducted on geographies consisting of 354,838,071 people shows a moderate negative correlation between the proportion of Immigrants from Eastern Africa and median household income in the United States with a correlation coefficient (R) of -0.429 and weighted average of $84,299, a difference of 0.35%.
Median Household Income Correlation Summary
| Measurement | Belgian | Immigrants from Eastern Africa |
| Minimum | $32,500 | $24,660 |
| Maximum | $93,194 | $149,957 |
| Range | $60,694 | $125,297 |
| Mean | $72,191 | $77,695 |
| Median | $72,683 | $82,646 |
| Interquartile 25% (IQ1) | $64,851 | $57,630 |
| Interquartile 75% (IQ3) | $82,059 | $89,428 |
| Interquartile Range (IQR) | $17,208 | $31,798 |
| Standard Deviation (Sample) | $12,788 | $24,325 |
| Standard Deviation (Population) | $12,659 | $24,166 |
Demographics Similar to Belgians and Immigrants from Eastern Africa by Median Household Income
In terms of median household income, the demographic groups most similar to Belgians are Puget Sound Salish ($84,011, a difference of 0.0%), Tlingit-Haida ($83,968, a difference of 0.050%), Kenyan ($84,085, a difference of 0.090%), Immigrants from Colombia ($83,902, a difference of 0.13%), and Slovak ($83,798, a difference of 0.25%). Similarly, the demographic groups most similar to Immigrants from Eastern Africa are Kenyan ($84,085, a difference of 0.25%), Puget Sound Salish ($84,011, a difference of 0.34%), Tlingit-Haida ($83,968, a difference of 0.39%), Spaniard ($84,644, a difference of 0.41%), and Uruguayan ($84,691, a difference of 0.47%).
| Demographics | Rating | Rank | Median Household Income |
| Immigrants | Costa Rica | 49.2 /100 | #175 | Average $85,054 |
| Alsatians | 49.2 /100 | #176 | Average $85,053 |
| Immigrants | Eritrea | 48.8 /100 | #177 | Average $85,025 |
| Czechoslovakians | 47.8 /100 | #178 | Average $84,965 |
| English | 47.0 /100 | #179 | Average $84,915 |
| Immigrants | Portugal | 44.2 /100 | #180 | Average $84,740 |
| Hawaiians | 44.1 /100 | #181 | Average $84,729 |
| Uruguayans | 43.5 /100 | #182 | Average $84,691 |
| Spaniards | 42.7 /100 | #183 | Average $84,644 |
| Immigrants | Eastern Africa | 37.4 /100 | #184 | Fair $84,299 |
| Kenyans | 34.2 /100 | #185 | Fair $84,085 |
| Puget Sound Salish | 33.2 /100 | #186 | Fair $84,011 |
| Belgians | 33.2 /100 | #187 | Fair $84,008 |
| Tlingit-Haida | 32.6 /100 | #188 | Fair $83,968 |
| Immigrants | Colombia | 31.7 /100 | #189 | Fair $83,902 |
| Slovaks | 30.2 /100 | #190 | Fair $83,798 |
| Iraqis | 29.6 /100 | #191 | Fair $83,753 |
| Welsh | 28.0 /100 | #192 | Fair $83,628 |
| Finns | 27.7 /100 | #193 | Fair $83,607 |
| Ghanaians | 27.4 /100 | #194 | Fair $83,582 |
| Immigrants | Armenia | 27.0 /100 | #195 | Fair $83,555 |