Belgian vs German Russian Householder Income Ages 45 - 64 years
COMPARE
Belgian
German Russian
Householder Income Ages 45 - 64 years
Householder Income Ages 45 - 64 years Comparison
Belgians
German Russians
$100,060
HOUSEHOLDER INCOME AGES 45 - 64 YEARS
46.7/ 100
METRIC RATING
179th/ 347
METRIC RANK
$89,398
HOUSEHOLDER INCOME AGES 45 - 64 YEARS
0.4/ 100
METRIC RATING
257th/ 347
METRIC RANK
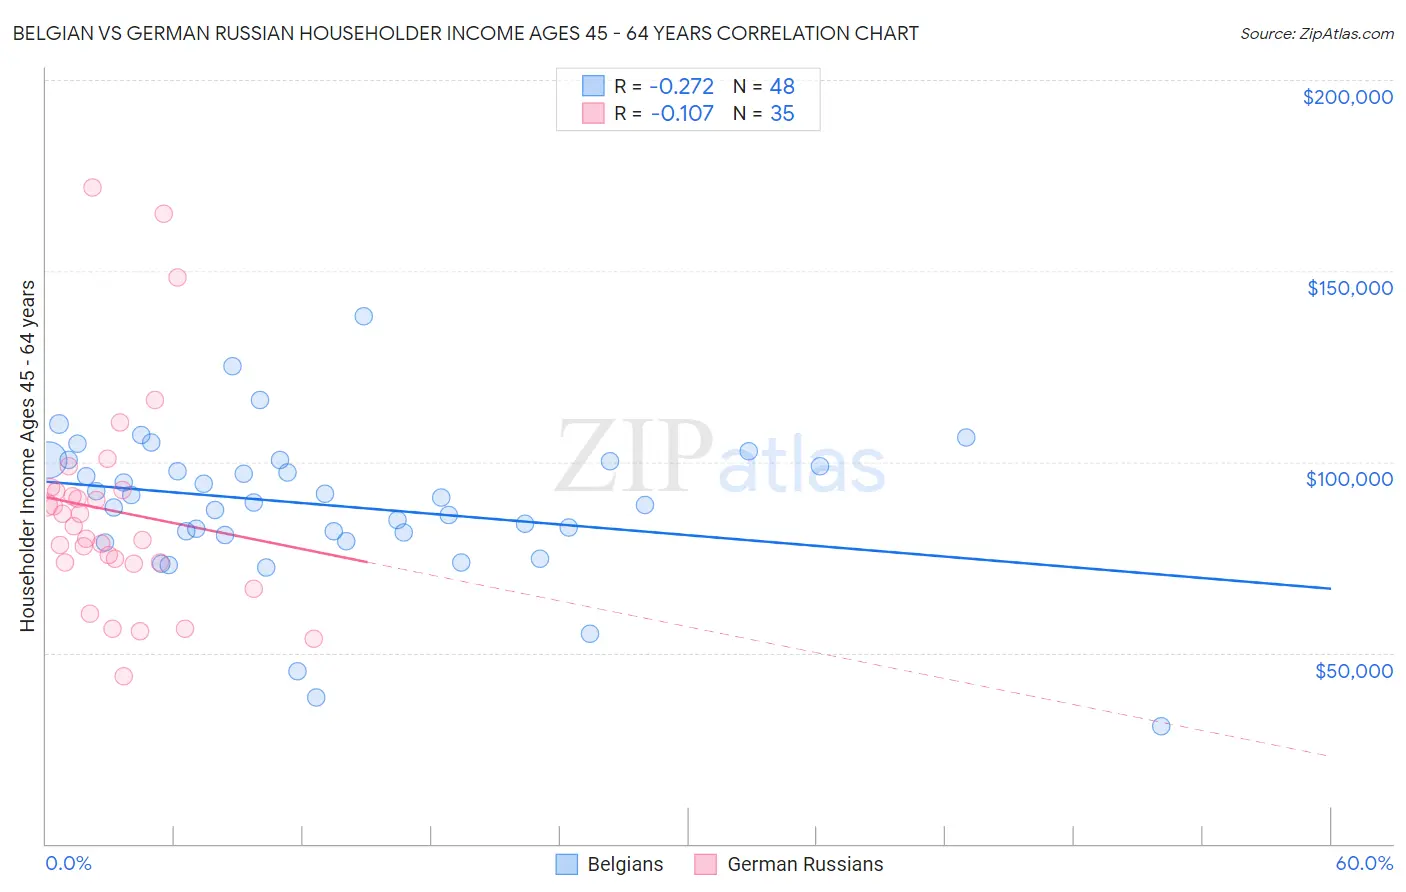
Belgian vs German Russian Householder Income Ages 45 - 64 years Correlation Chart
The statistical analysis conducted on geographies consisting of 355,498,579 people shows a weak negative correlation between the proportion of Belgians and household income with householder between the ages 45 and 64 in the United States with a correlation coefficient (R) of -0.272 and weighted average of $100,060. Similarly, the statistical analysis conducted on geographies consisting of 96,410,243 people shows a poor negative correlation between the proportion of German Russians and household income with householder between the ages 45 and 64 in the United States with a correlation coefficient (R) of -0.107 and weighted average of $89,398, a difference of 11.9%.
Householder Income Ages 45 - 64 years Correlation Summary
| Measurement | Belgian | German Russian |
| Minimum | $30,833 | $43,750 |
| Maximum | $138,162 | $171,788 |
| Range | $107,329 | $128,038 |
| Mean | $88,608 | $87,182 |
| Median | $89,979 | $83,043 |
| Interquartile 25% (IQ1) | $81,216 | $73,744 |
| Interquartile 75% (IQ3) | $100,318 | $92,651 |
| Interquartile Range (IQR) | $19,101 | $18,907 |
| Standard Deviation (Sample) | $19,546 | $28,210 |
| Standard Deviation (Population) | $19,341 | $27,804 |
Similar Demographics by Householder Income Ages 45 - 64 years
Demographics Similar to Belgians by Householder Income Ages 45 - 64 years
In terms of householder income ages 45 - 64 years, the demographic groups most similar to Belgians are Aleut ($100,052, a difference of 0.010%), Immigrants from Cameroon ($100,084, a difference of 0.020%), Immigrants from Costa Rica ($100,141, a difference of 0.080%), Moroccan ($100,138, a difference of 0.080%), and Immigrants ($99,943, a difference of 0.12%).
| Demographics | Rating | Rank | Householder Income Ages 45 - 64 years |
| Immigrants | Uzbekistan | 52.5 /100 | #172 | Average $100,523 |
| Alsatians | 51.4 /100 | #173 | Average $100,435 |
| Welsh | 50.0 /100 | #174 | Average $100,322 |
| Germans | 48.8 /100 | #175 | Average $100,224 |
| Immigrants | Costa Rica | 47.7 /100 | #176 | Average $100,141 |
| Moroccans | 47.7 /100 | #177 | Average $100,138 |
| Immigrants | Cameroon | 47.0 /100 | #178 | Average $100,084 |
| Belgians | 46.7 /100 | #179 | Average $100,060 |
| Aleuts | 46.6 /100 | #180 | Average $100,052 |
| Immigrants | Immigrants | 45.3 /100 | #181 | Average $99,943 |
| Finns | 44.8 /100 | #182 | Average $99,904 |
| Spaniards | 44.6 /100 | #183 | Average $99,889 |
| French | 43.8 /100 | #184 | Average $99,824 |
| Colombians | 43.2 /100 | #185 | Average $99,772 |
| Dutch | 41.7 /100 | #186 | Average $99,650 |
Demographics Similar to German Russians by Householder Income Ages 45 - 64 years
In terms of householder income ages 45 - 64 years, the demographic groups most similar to German Russians are Immigrants from Barbados ($89,394, a difference of 0.0%), Immigrants from Nicaragua ($89,108, a difference of 0.33%), French American Indian ($89,811, a difference of 0.46%), Liberian ($88,929, a difference of 0.53%), and West Indian ($89,906, a difference of 0.57%).
| Demographics | Rating | Rank | Householder Income Ages 45 - 64 years |
| Sub-Saharan Africans | 0.8 /100 | #250 | Tragic $90,691 |
| Americans | 0.7 /100 | #251 | Tragic $90,536 |
| Marshallese | 0.7 /100 | #252 | Tragic $90,455 |
| Barbadians | 0.6 /100 | #253 | Tragic $90,266 |
| Immigrants | Guyana | 0.6 /100 | #254 | Tragic $90,186 |
| West Indians | 0.5 /100 | #255 | Tragic $89,906 |
| French American Indians | 0.5 /100 | #256 | Tragic $89,811 |
| German Russians | 0.4 /100 | #257 | Tragic $89,398 |
| Immigrants | Barbados | 0.4 /100 | #258 | Tragic $89,394 |
| Immigrants | Nicaragua | 0.4 /100 | #259 | Tragic $89,108 |
| Liberians | 0.3 /100 | #260 | Tragic $88,929 |
| Belizeans | 0.3 /100 | #261 | Tragic $88,684 |
| Somalis | 0.3 /100 | #262 | Tragic $88,600 |
| Immigrants | Senegal | 0.3 /100 | #263 | Tragic $88,421 |
| Osage | 0.3 /100 | #264 | Tragic $88,390 |