Basque vs Subsaharan African Householder Income Ages 25 - 44 years
COMPARE
Basque
Subsaharan African
Householder Income Ages 25 - 44 years
Householder Income Ages 25 - 44 years Comparison
Basques
Sub-Saharan Africans
$96,709
HOUSEHOLDER INCOME AGES 25 - 44 YEARS
76.6/ 100
METRIC RATING
149th/ 347
METRIC RANK
$84,235
HOUSEHOLDER INCOME AGES 25 - 44 YEARS
0.3/ 100
METRIC RATING
268th/ 347
METRIC RANK
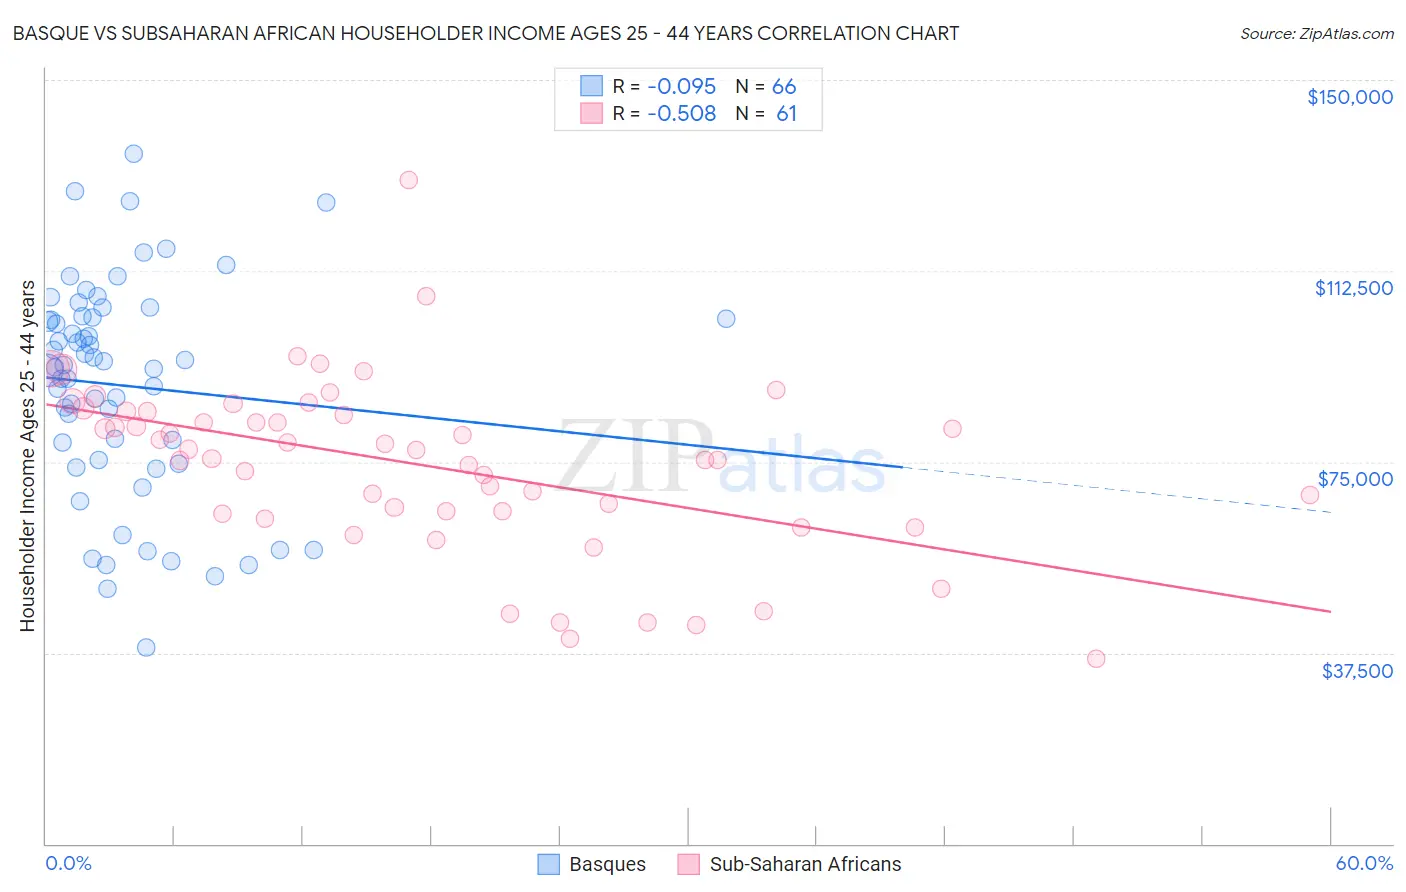
Basque vs Subsaharan African Householder Income Ages 25 - 44 years Correlation Chart
The statistical analysis conducted on geographies consisting of 165,637,052 people shows a slight negative correlation between the proportion of Basques and household income with householder between the ages 25 and 44 in the United States with a correlation coefficient (R) of -0.095 and weighted average of $96,709. Similarly, the statistical analysis conducted on geographies consisting of 505,523,200 people shows a substantial negative correlation between the proportion of Sub-Saharan Africans and household income with householder between the ages 25 and 44 in the United States with a correlation coefficient (R) of -0.508 and weighted average of $84,235, a difference of 14.8%.
Householder Income Ages 25 - 44 years Correlation Summary
| Measurement | Basque | Subsaharan African |
| Minimum | $38,438 | $36,409 |
| Maximum | $135,625 | $130,453 |
| Range | $97,187 | $94,044 |
| Mean | $89,960 | $74,443 |
| Median | $93,797 | $77,380 |
| Interquartile 25% (IQ1) | $75,288 | $65,093 |
| Interquartile 75% (IQ3) | $103,321 | $84,848 |
| Interquartile Range (IQR) | $28,033 | $19,755 |
| Standard Deviation (Sample) | $21,216 | $17,109 |
| Standard Deviation (Population) | $21,055 | $16,968 |
Similar Demographics by Householder Income Ages 25 - 44 years
Demographics Similar to Basques by Householder Income Ages 25 - 44 years
In terms of householder income ages 25 - 44 years, the demographic groups most similar to Basques are Irish ($96,730, a difference of 0.020%), Ugandan ($96,667, a difference of 0.040%), Immigrants from Syria ($96,789, a difference of 0.080%), Ethiopian ($96,824, a difference of 0.12%), and Norwegian ($96,866, a difference of 0.16%).
| Demographics | Rating | Rank | Householder Income Ages 25 - 44 years |
| Danes | 81.3 /100 | #142 | Excellent $97,221 |
| Immigrants | Jordan | 81.0 /100 | #143 | Excellent $97,185 |
| Immigrants | Chile | 80.8 /100 | #144 | Excellent $97,159 |
| Norwegians | 78.2 /100 | #145 | Good $96,866 |
| Ethiopians | 77.8 /100 | #146 | Good $96,824 |
| Immigrants | Syria | 77.4 /100 | #147 | Good $96,789 |
| Irish | 76.9 /100 | #148 | Good $96,730 |
| Basques | 76.6 /100 | #149 | Good $96,709 |
| Ugandans | 76.2 /100 | #150 | Good $96,667 |
| Czechs | 74.8 /100 | #151 | Good $96,525 |
| South American Indians | 74.5 /100 | #152 | Good $96,497 |
| Slovenes | 73.9 /100 | #153 | Good $96,439 |
| Slavs | 73.2 /100 | #154 | Good $96,377 |
| Moroccans | 70.3 /100 | #155 | Good $96,117 |
| Immigrants | Germany | 67.9 /100 | #156 | Good $95,913 |
Demographics Similar to Sub-Saharan Africans by Householder Income Ages 25 - 44 years
In terms of householder income ages 25 - 44 years, the demographic groups most similar to Sub-Saharan Africans are Hmong ($84,258, a difference of 0.030%), Immigrants from Cabo Verde ($84,304, a difference of 0.080%), Spanish American Indian ($84,085, a difference of 0.18%), Sudanese ($84,401, a difference of 0.20%), and Osage ($84,461, a difference of 0.27%).
| Demographics | Rating | Rank | Householder Income Ages 25 - 44 years |
| Inupiat | 0.4 /100 | #261 | Tragic $84,619 |
| Cree | 0.4 /100 | #262 | Tragic $84,574 |
| Belizeans | 0.4 /100 | #263 | Tragic $84,534 |
| Osage | 0.4 /100 | #264 | Tragic $84,461 |
| Sudanese | 0.4 /100 | #265 | Tragic $84,401 |
| Immigrants | Cabo Verde | 0.3 /100 | #266 | Tragic $84,304 |
| Hmong | 0.3 /100 | #267 | Tragic $84,258 |
| Sub-Saharan Africans | 0.3 /100 | #268 | Tragic $84,235 |
| Spanish American Indians | 0.3 /100 | #269 | Tragic $84,085 |
| Jamaicans | 0.3 /100 | #270 | Tragic $83,933 |
| Somalis | 0.2 /100 | #271 | Tragic $83,752 |
| Spanish Americans | 0.2 /100 | #272 | Tragic $83,722 |
| Iroquois | 0.2 /100 | #273 | Tragic $83,682 |
| Marshallese | 0.2 /100 | #274 | Tragic $83,575 |
| Immigrants | Jamaica | 0.2 /100 | #275 | Tragic $83,298 |