Barbadian vs Immigrants from Western Africa Householder Income Ages 25 - 44 years
COMPARE
Barbadian
Immigrants from Western Africa
Householder Income Ages 25 - 44 years
Householder Income Ages 25 - 44 years Comparison
Barbadians
Immigrants from Western Africa
$89,565
HOUSEHOLDER INCOME AGES 25 - 44 YEARS
5.9/ 100
METRIC RATING
224th/ 347
METRIC RANK
$85,676
HOUSEHOLDER INCOME AGES 25 - 44 YEARS
0.7/ 100
METRIC RATING
252nd/ 347
METRIC RANK
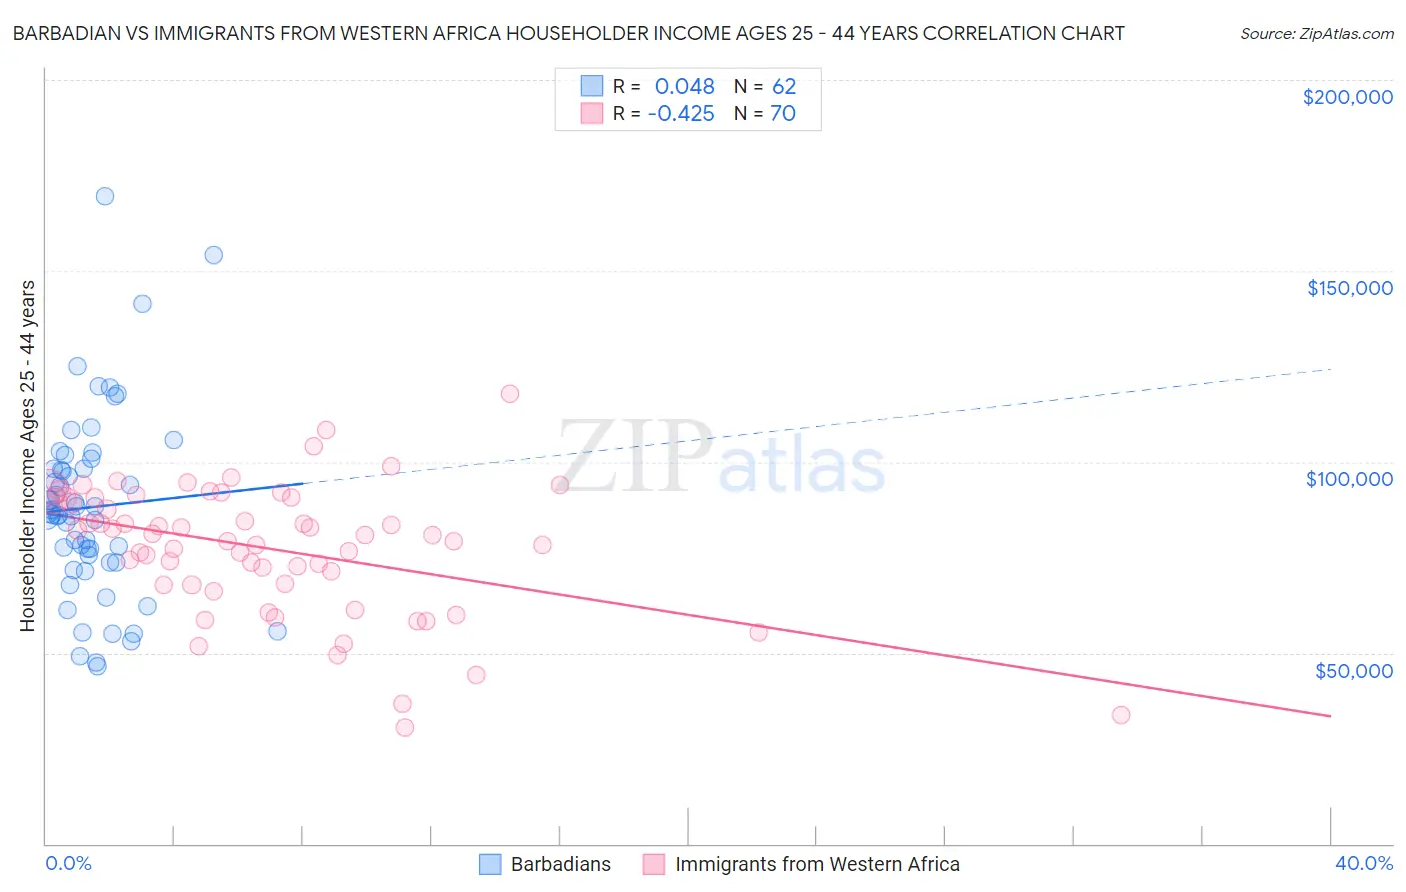
Barbadian vs Immigrants from Western Africa Householder Income Ages 25 - 44 years Correlation Chart
The statistical analysis conducted on geographies consisting of 141,212,757 people shows no correlation between the proportion of Barbadians and household income with householder between the ages 25 and 44 in the United States with a correlation coefficient (R) of 0.048 and weighted average of $89,565. Similarly, the statistical analysis conducted on geographies consisting of 357,136,258 people shows a moderate negative correlation between the proportion of Immigrants from Western Africa and household income with householder between the ages 25 and 44 in the United States with a correlation coefficient (R) of -0.425 and weighted average of $85,676, a difference of 4.5%.
Householder Income Ages 25 - 44 years Correlation Summary
| Measurement | Barbadian | Immigrants from Western Africa |
| Minimum | $46,484 | $30,517 |
| Maximum | $169,656 | $117,804 |
| Range | $123,172 | $87,287 |
| Mean | $88,113 | $77,170 |
| Median | $86,577 | $80,034 |
| Interquartile 25% (IQ1) | $73,781 | $67,813 |
| Interquartile 75% (IQ3) | $98,316 | $90,526 |
| Interquartile Range (IQR) | $24,535 | $22,713 |
| Standard Deviation (Sample) | $24,335 | $17,090 |
| Standard Deviation (Population) | $24,138 | $16,967 |
Similar Demographics by Householder Income Ages 25 - 44 years
Demographics Similar to Barbadians by Householder Income Ages 25 - 44 years
In terms of householder income ages 25 - 44 years, the demographic groups most similar to Barbadians are Immigrants from Guyana ($89,586, a difference of 0.020%), Immigrants from Ecuador ($89,673, a difference of 0.12%), Immigrants from Panama ($89,451, a difference of 0.13%), Immigrants from Iraq ($89,444, a difference of 0.14%), and Immigrants from Trinidad and Tobago ($89,748, a difference of 0.20%).
| Demographics | Rating | Rank | Householder Income Ages 25 - 44 years |
| Scotch-Irish | 7.3 /100 | #217 | Tragic $89,969 |
| Guyanese | 7.1 /100 | #218 | Tragic $89,940 |
| Delaware | 6.9 /100 | #219 | Tragic $89,876 |
| Trinidadians and Tobagonians | 6.8 /100 | #220 | Tragic $89,856 |
| Immigrants | Trinidad and Tobago | 6.5 /100 | #221 | Tragic $89,748 |
| Immigrants | Ecuador | 6.2 /100 | #222 | Tragic $89,673 |
| Immigrants | Guyana | 5.9 /100 | #223 | Tragic $89,586 |
| Barbadians | 5.9 /100 | #224 | Tragic $89,565 |
| Immigrants | Panama | 5.5 /100 | #225 | Tragic $89,451 |
| Immigrants | Iraq | 5.5 /100 | #226 | Tragic $89,444 |
| Immigrants | St. Vincent and the Grenadines | 4.1 /100 | #227 | Tragic $88,888 |
| Immigrants | Bosnia and Herzegovina | 4.0 /100 | #228 | Tragic $88,819 |
| Immigrants | Barbados | 3.7 /100 | #229 | Tragic $88,687 |
| Alaskan Athabascans | 3.3 /100 | #230 | Tragic $88,446 |
| Immigrants | Grenada | 3.0 /100 | #231 | Tragic $88,311 |
Demographics Similar to Immigrants from Western Africa by Householder Income Ages 25 - 44 years
In terms of householder income ages 25 - 44 years, the demographic groups most similar to Immigrants from Western Africa are Cape Verdean ($85,758, a difference of 0.10%), British West Indian ($85,565, a difference of 0.13%), Immigrants from Laos ($85,553, a difference of 0.14%), Pennsylvania German ($85,836, a difference of 0.19%), and French American Indian ($85,899, a difference of 0.26%).
| Demographics | Rating | Rank | Householder Income Ages 25 - 44 years |
| Immigrants | El Salvador | 1.4 /100 | #245 | Tragic $86,913 |
| Immigrants | Burma/Myanmar | 1.3 /100 | #246 | Tragic $86,736 |
| Immigrants | Nigeria | 1.2 /100 | #247 | Tragic $86,589 |
| Immigrants | Sudan | 0.9 /100 | #248 | Tragic $86,109 |
| French American Indians | 0.8 /100 | #249 | Tragic $85,899 |
| Pennsylvania Germans | 0.8 /100 | #250 | Tragic $85,836 |
| Cape Verdeans | 0.8 /100 | #251 | Tragic $85,758 |
| Immigrants | Western Africa | 0.7 /100 | #252 | Tragic $85,676 |
| British West Indians | 0.7 /100 | #253 | Tragic $85,565 |
| Immigrants | Laos | 0.7 /100 | #254 | Tragic $85,553 |
| German Russians | 0.6 /100 | #255 | Tragic $85,220 |
| Central Americans | 0.5 /100 | #256 | Tragic $85,144 |
| Mexican American Indians | 0.5 /100 | #257 | Tragic $85,066 |
| Immigrants | Nicaragua | 0.5 /100 | #258 | Tragic $84,914 |
| Immigrants | Senegal | 0.5 /100 | #259 | Tragic $84,848 |