Bangladeshi vs Immigrants from France Householder Income Ages 45 - 64 years

COMPARE

Bangladeshi
Race
Ancestry
AfghanAfricanAlaska NativeAlaskan AthabascanAlbanianAleutAlsatianAmericanApacheArabArapahoArgentineanArmenianAssyrian/Chaldean/SyriacAustralianAustrianBahamianBangladeshiBarbadianBasqueBelgianBelizeanBermudanBhutaneseBlackfeetBolivianBrazilianBritishBritish West IndianBulgarianBurmeseCajunCambodianCanadianCape VerdeanCarpatho RusynCelticCentral AmericanCentral American IndianCherokeeCheyenneChickasawChileanChineseChippewaChoctawColombianColvilleComancheCosta RicanCreeCreekCroatianCrowCubanCypriotCzechCzechoslovakianDanishDelawareDominicanDutchDutch West IndianEastern EuropeanEcuadorianEgyptianEnglishEstonianEthiopianEuropeanFijianFilipinoFinnishFrenchFrench American IndianFrench CanadianGermanGerman RussianGhanaianGreekGuamanian/ChamorroGuatemalanGuyaneseHaitianHmongHonduranHopiHoumaHungarianIcelanderIndian (Asian)IndonesianInupiatIranianIraqiIrishIroquoisIsraeliItalianJamaicanJapaneseJordanianKenyanKiowaKoreanLaotianLatvianLebaneseLiberianLithuanianLumbeeLuxembourgerMacedonianMalaysianMalteseMarshalleseMenomineeMexicanMexican American IndianMongolianMoroccanNative HawaiianNavajoNepaleseNew ZealanderNicaraguanNigerianNorthern EuropeanNorwegianOkinawanOsageOttawaPaiutePakistaniPalestinianPanamanianParaguayanPennsylvania GermanPeruvianPimaPolishPortuguesePotawatomiPuebloPuerto RicanPuget Sound SalishRomanianRussianSalvadoranSamoanScandinavianScotch-IrishScottishSeminoleSenegaleseSerbianShoshoneSierra LeoneanSiouxSlavicSlovakSloveneSomaliSouth AfricanSouth AmericanSouth American IndianSoviet UnionSpaniardSpanishSpanish AmericanSpanish American IndianSri LankanSubsaharan AfricanSudaneseSwedishSwissSyrianTaiwaneseThaiTlingit-HaidaTohono O'OdhamTonganTrinidadian and TobagonianTsimshianTurkishU.S. Virgin IslanderUgandanUkrainianUruguayanUteVenezuelanVietnameseWelshWest IndianYakamaYaquiYugoslavianYumanYup'ikZimbabwean
Immigration
NonimmigrantsImmigrantsAfghanistanAfricaAlbaniaArgentinaArmeniaAsiaAustraliaAustriaBahamasBangladeshBarbadosBelarusBelgiumBelizeBoliviaBosnia and HerzegovinaBrazilBulgariaBurma/MyanmarCabo VerdeCambodiaCameroonCanadaCaribbeanCentral AmericaChileChinaColombiaCongoCosta RicaCroatiaCubaCzechoslovakiaDenmarkDominicaDominican RepublicEastern AfricaEastern AsiaEastern EuropeEcuadorEgyptEl SalvadorEnglandEritreaEthiopiaEuropeFijiGermanyGhanaGreeceGrenadaGuatemalaGuyanaHaitiHondurasHong KongHungaryIndiaIndonesiaIranIraqIrelandIsraelItalyJamaicaJapanJordanKazakhstanKenyaKoreaKuwaitLaosLatin AmericaLatviaLebanonLiberiaLithuaniaMalaysiaMexicoMicronesiaMiddle AfricaMoldovaMoroccoNepalNetherlandsNicaraguaNigeriaNorth AmericaNorth MacedoniaNorthern AfricaNorthern EuropeNorwayOceaniaPakistanPanamaPeruPhilippinesPolandPortugalRomaniaRussiaSaudi ArabiaScotlandSenegalSerbiaSierra LeoneSingaporeSomaliaSouth AfricaSouth AmericaSouth Central AsiaSouth Eastern AsiaSouthern EuropeSpainSri LankaSt. Vincent and the GrenadinesSudanSwedenSwitzerlandSyriaTaiwanThailandTrinidad and TobagoTurkeyUgandaUkraineUruguayUzbekistanVenezuelaVietnamWest IndiesWestern AfricaWestern AsiaWestern EuropeYemenZaireZimbabweAzores
Immigrants from France
Race
Ancestry
AfghanAfricanAlaska NativeAlaskan AthabascanAlbanianAleutAlsatianAmericanApacheArabArapahoArgentineanArmenianAssyrian/Chaldean/SyriacAustralianAustrianBahamianBarbadianBasqueBelgianBelizeanBermudanBhutaneseBlackfeetBolivianBrazilianBritishBritish West IndianBulgarianBurmeseCajunCambodianCanadianCape VerdeanCarpatho RusynCelticCentral AmericanCentral American IndianCherokeeCheyenneChickasawChileanChineseChippewaChoctawColombianColvilleComancheCosta RicanCreeCreekCroatianCrowCubanCypriotCzechCzechoslovakianDanishDelawareDominicanDutchDutch West IndianEastern EuropeanEcuadorianEgyptianEnglishEstonianEthiopianEuropeanFijianFilipinoFinnishFrenchFrench American IndianFrench CanadianGermanGerman RussianGhanaianGreekGuamanian/ChamorroGuatemalanGuyaneseHaitianHmongHonduranHopiHoumaHungarianIcelanderIndian (Asian)IndonesianInupiatIranianIraqiIrishIroquoisIsraeliItalianJamaicanJapaneseJordanianKenyanKiowaKoreanLaotianLatvianLebaneseLiberianLithuanianLumbeeLuxembourgerMacedonianMalaysianMalteseMarshalleseMenomineeMexicanMexican American IndianMongolianMoroccanNative HawaiianNavajoNepaleseNew ZealanderNicaraguanNigerianNorthern EuropeanNorwegianOkinawanOsageOttawaPaiutePakistaniPalestinianPanamanianParaguayanPennsylvania GermanPeruvianPimaPolishPortuguesePotawatomiPuebloPuerto RicanPuget Sound SalishRomanianRussianSalvadoranSamoanScandinavianScotch-IrishScottishSeminoleSenegaleseSerbianShoshoneSierra LeoneanSiouxSlavicSlovakSloveneSomaliSouth AfricanSouth AmericanSouth American IndianSoviet UnionSpaniardSpanishSpanish AmericanSpanish American IndianSri LankanSubsaharan AfricanSudaneseSwedishSwissSyrianTaiwaneseThaiTlingit-HaidaTohono O'OdhamTonganTrinidadian and TobagonianTsimshianTurkishU.S. Virgin IslanderUgandanUkrainianUruguayanUteVenezuelanVietnameseWelshWest IndianYakamaYaquiYugoslavianYumanYup'ikZimbabwean
Immigration
NonimmigrantsImmigrantsAfghanistanAfricaAlbaniaArgentinaArmeniaAsiaAustraliaAustriaBahamasBangladeshBarbadosBelarusBelgiumBelizeBoliviaBosnia and HerzegovinaBrazilBulgariaBurma/MyanmarCabo VerdeCambodiaCameroonCanadaCaribbeanCentral AmericaChileChinaColombiaCongoCosta RicaCroatiaCubaCzechoslovakiaDenmarkDominicaDominican RepublicEastern AfricaEastern AsiaEastern EuropeEcuadorEgyptEl SalvadorEnglandEritreaEthiopiaEuropeFijiFranceGermanyGhanaGreeceGrenadaGuatemalaGuyanaHaitiHondurasHong KongHungaryIndiaIndonesiaIranIraqIrelandIsraelItalyJamaicaJapanJordanKazakhstanKenyaKoreaKuwaitLaosLatin AmericaLatviaLebanonLiberiaLithuaniaMalaysiaMexicoMicronesiaMiddle AfricaMoldovaMoroccoNepalNetherlandsNicaraguaNigeriaNorth AmericaNorth MacedoniaNorthern AfricaNorthern EuropeNorwayOceaniaPakistanPanamaPeruPhilippinesPolandPortugalRomaniaRussiaSaudi ArabiaScotlandSenegalSerbiaSierra LeoneSingaporeSomaliaSouth AfricaSouth AmericaSouth Central AsiaSouth Eastern AsiaSouthern EuropeSpainSri LankaSt. Vincent and the GrenadinesSudanSwedenSwitzerlandSyriaTaiwanThailandTrinidad and TobagoTurkeyUgandaUkraineUruguayUzbekistanVenezuelaVietnamWest IndiesWestern AfricaWestern AsiaWestern EuropeYemenZaireZimbabweAzores
Householder Income Ages 45 - 64 years
Income
Poverty
Unemployment
Labor Participation
Family Structure
Vehicle Availability
Education Level
Disability

Householder Income Ages 45 - 64 years Comparison

Bangladeshis

Immigrants from France

Tragic
Exceptional
$86,402
HOUSEHOLDER INCOME AGES 45 - 64 YEARS
0.1/ 100
METRIC RATING
287th/ 347
METRIC RANK
$113,680
HOUSEHOLDER INCOME AGES 45 - 64 YEARS
99.9/ 100
METRIC RATING
45th/ 347
METRIC RANK

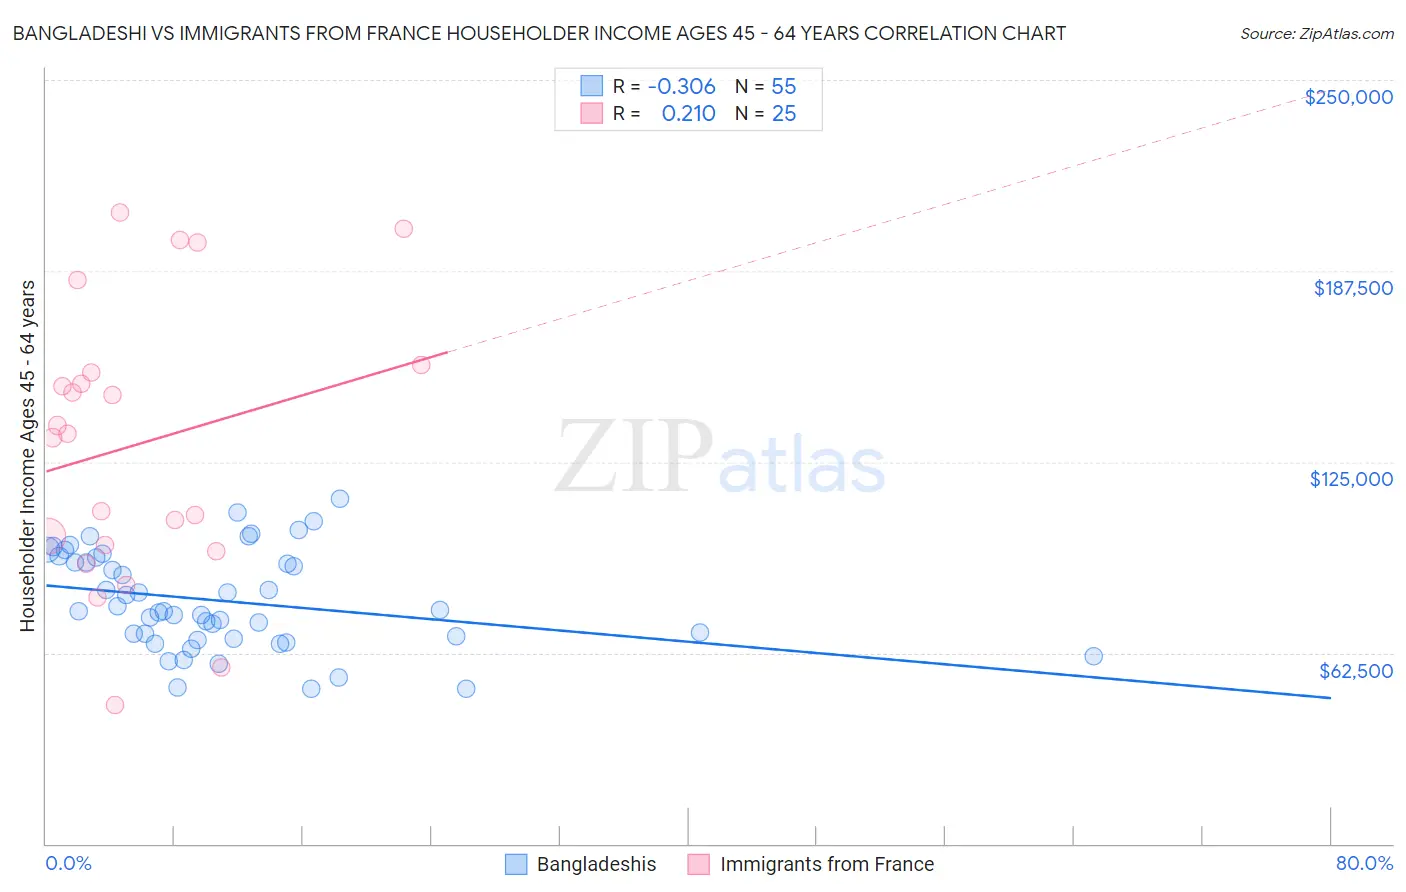
Bangladeshi vs Immigrants from France Householder Income Ages 45 - 64 years Correlation Chart

The statistical analysis conducted on geographies consisting of 141,236,471 people shows a mild negative correlation between the proportion of Bangladeshis and household income with householder between the ages 45 and 64 in the United States with a correlation coefficient (R) of -0.306 and weighted average of $86,402. Similarly, the statistical analysis conducted on geographies consisting of 287,674,634 people shows a weak positive correlation between the proportion of Immigrants from France and household income with householder between the ages 45 and 64 in the United States with a correlation coefficient (R) of 0.210 and weighted average of $113,680, a difference of 31.6%.
Bangladeshi vs Immigrants from France Householder Income Ages 45 - 64 years

Householder Income Ages 45 - 64 years Correlation Summary

MeasurementBangladeshiImmigrants from France
Minimum$50,598$45,521
Maximum$113,000$206,746
Range$62,402$161,225
Mean$79,486$130,914
Median$76,107$134,293
Interquartile 25% (IQ1)$66,969$96,696
Interquartile 75% (IQ3)$93,746$155,402
Interquartile Range (IQR)$26,777$58,706
Standard Deviation (Sample)$15,976$45,085
Standard Deviation (Population)$15,831$44,174

Similar Demographics by Householder Income Ages 45 - 64 years

Demographics Similar to Bangladeshis by Householder Income Ages 45 - 64 years

In terms of householder income ages 45 - 64 years, the demographic groups most similar to Bangladeshis are Immigrants from St. Vincent and the Grenadines ($86,394, a difference of 0.010%), Cuban ($86,301, a difference of 0.12%), Immigrants from Guatemala ($86,573, a difference of 0.20%), Blackfeet ($86,595, a difference of 0.22%), and Cherokee ($86,125, a difference of 0.32%).
DemographicsRating | RankHouseholder Income Ages 45 - 64 years
Immigrants | Somalia
0.1
/100
|
#280
Tragic
$86,987
Yaqui
0.1
/100
|
#281
Tragic
$86,914
Senegalese
0.1
/100
|
#282
Tragic
$86,897
Mexicans
0.1
/100
|
#283
Tragic
$86,816
Central American Indians
0.1
/100
|
#284
Tragic
$86,764
Blackfeet
0.1
/100
|
#285
Tragic
$86,595
Immigrants | Guatemala
0.1
/100
|
#286
Tragic
$86,573
Bangladeshis
0.1
/100
|
#287
Tragic
$86,402
Immigrants | St. Vincent and the Grenadines
0.1
/100
|
#288
Tragic
$86,394
Cubans
0.1
/100
|
#289
Tragic
$86,301
Cherokee
0.1
/100
|
#290
Tragic
$86,125
Hispanics or Latinos
0.1
/100
|
#291
Tragic
$86,006
Immigrants | Central America
0.1
/100
|
#292
Tragic
$85,965
Comanche
0.1
/100
|
#293
Tragic
$85,787
British West Indians
0.1
/100
|
#294
Tragic
$85,571

Demographics Similar to Immigrants from France by Householder Income Ages 45 - 64 years

In terms of householder income ages 45 - 64 years, the demographic groups most similar to Immigrants from France are Immigrants from Greece ($113,548, a difference of 0.12%), Australian ($113,533, a difference of 0.13%), Immigrants from Indonesia ($113,519, a difference of 0.14%), Bulgarian ($113,883, a difference of 0.18%), and Immigrants from Russia ($113,215, a difference of 0.41%).
DemographicsRating | RankHouseholder Income Ages 45 - 64 years
Immigrants | Pakistan
99.9
/100
|
#38
Exceptional
$114,434
Immigrants | Turkey
99.9
/100
|
#39
Exceptional
$114,407
Cambodians
99.9
/100
|
#40
Exceptional
$114,342
Immigrants | Lithuania
99.9
/100
|
#41
Exceptional
$114,336
Estonians
99.9
/100
|
#42
Exceptional
$114,220
Israelis
99.9
/100
|
#43
Exceptional
$114,186
Bulgarians
99.9
/100
|
#44
Exceptional
$113,883
Immigrants | France
99.9
/100
|
#45
Exceptional
$113,680
Immigrants | Greece
99.9
/100
|
#46
Exceptional
$113,548
Australians
99.9
/100
|
#47
Exceptional
$113,533
Immigrants | Indonesia
99.9
/100
|
#48
Exceptional
$113,519
Immigrants | Russia
99.8
/100
|
#49
Exceptional
$113,215
Immigrants | Austria
99.8
/100
|
#50
Exceptional
$113,140
Immigrants | South Africa
99.8
/100
|
#51
Exceptional
$112,886
Immigrants | Malaysia
99.8
/100
|
#52
Exceptional
$112,796