Bahamian vs Immigrants from Pakistan Median Female Earnings
COMPARE
Bahamian
Immigrants from Pakistan
Median Female Earnings
Median Female Earnings Comparison
Bahamians
Immigrants from Pakistan
$35,125
MEDIAN FEMALE EARNINGS
0.0/ 100
METRIC RATING
305th/ 347
METRIC RANK
$43,052
MEDIAN FEMALE EARNINGS
99.9/ 100
METRIC RATING
64th/ 347
METRIC RANK
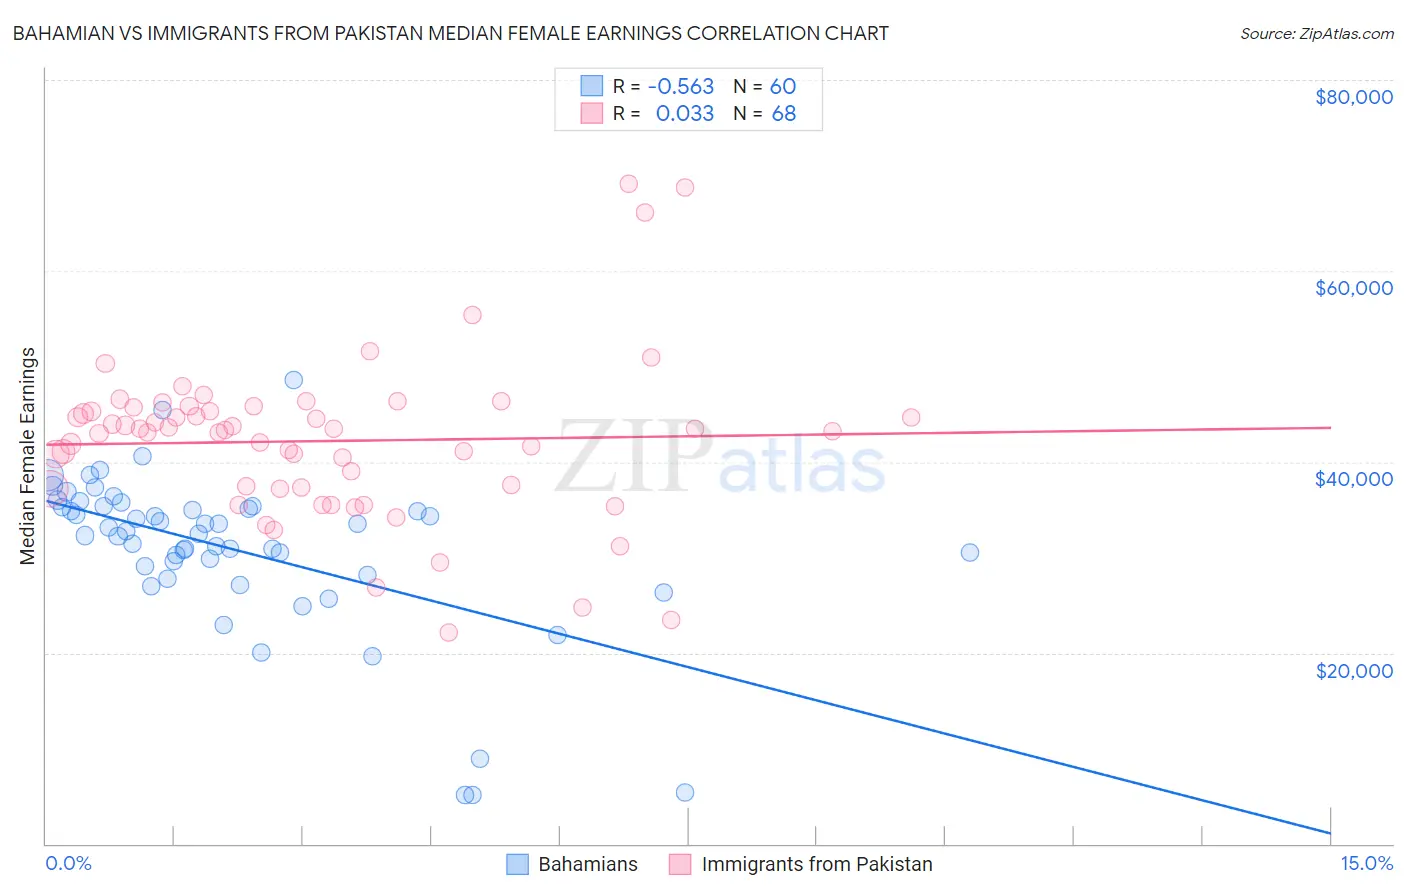
Bahamian vs Immigrants from Pakistan Median Female Earnings Correlation Chart
The statistical analysis conducted on geographies consisting of 112,672,199 people shows a substantial negative correlation between the proportion of Bahamians and median female earnings in the United States with a correlation coefficient (R) of -0.563 and weighted average of $35,125. Similarly, the statistical analysis conducted on geographies consisting of 283,887,032 people shows no correlation between the proportion of Immigrants from Pakistan and median female earnings in the United States with a correlation coefficient (R) of 0.033 and weighted average of $43,052, a difference of 22.6%.
Median Female Earnings Correlation Summary
| Measurement | Bahamian | Immigrants from Pakistan |
| Minimum | $5,063 | $22,138 |
| Maximum | $48,590 | $69,138 |
| Range | $43,527 | $47,000 |
| Mean | $30,808 | $42,182 |
| Median | $32,617 | $43,220 |
| Interquartile 25% (IQ1) | $28,645 | $37,265 |
| Interquartile 75% (IQ3) | $35,290 | $45,503 |
| Interquartile Range (IQR) | $6,645 | $8,238 |
| Standard Deviation (Sample) | $8,476 | $8,546 |
| Standard Deviation (Population) | $8,405 | $8,483 |
Similar Demographics by Median Female Earnings
Demographics Similar to Bahamians by Median Female Earnings
In terms of median female earnings, the demographic groups most similar to Bahamians are Fijian ($35,114, a difference of 0.030%), Sioux ($35,063, a difference of 0.18%), Immigrants from Bahamas ($35,027, a difference of 0.28%), Honduran ($35,013, a difference of 0.32%), and Chippewa ($35,003, a difference of 0.35%).
| Demographics | Rating | Rank | Median Female Earnings |
| Immigrants | Micronesia | 0.0 /100 | #298 | Tragic $35,477 |
| Immigrants | Guatemala | 0.0 /100 | #299 | Tragic $35,444 |
| Yuman | 0.0 /100 | #300 | Tragic $35,377 |
| Pima | 0.0 /100 | #301 | Tragic $35,326 |
| Blacks/African Americans | 0.0 /100 | #302 | Tragic $35,315 |
| Immigrants | Latin America | 0.0 /100 | #303 | Tragic $35,307 |
| Crow | 0.0 /100 | #304 | Tragic $35,266 |
| Bahamians | 0.0 /100 | #305 | Tragic $35,125 |
| Fijians | 0.0 /100 | #306 | Tragic $35,114 |
| Sioux | 0.0 /100 | #307 | Tragic $35,063 |
| Immigrants | Bahamas | 0.0 /100 | #308 | Tragic $35,027 |
| Hondurans | 0.0 /100 | #309 | Tragic $35,013 |
| Chippewa | 0.0 /100 | #310 | Tragic $35,003 |
| Ute | 0.0 /100 | #311 | Tragic $34,960 |
| Yaqui | 0.0 /100 | #312 | Tragic $34,943 |
Demographics Similar to Immigrants from Pakistan by Median Female Earnings
In terms of median female earnings, the demographic groups most similar to Immigrants from Pakistan are Immigrants from Ukraine ($43,069, a difference of 0.040%), Afghan ($43,077, a difference of 0.060%), Immigrants from Bulgaria ($43,085, a difference of 0.080%), Immigrants from Latvia ($43,099, a difference of 0.11%), and Estonian ($43,106, a difference of 0.12%).
| Demographics | Rating | Rank | Median Female Earnings |
| Ethiopians | 99.9 /100 | #57 | Exceptional $43,243 |
| Paraguayans | 99.9 /100 | #58 | Exceptional $43,173 |
| Estonians | 99.9 /100 | #59 | Exceptional $43,106 |
| Immigrants | Latvia | 99.9 /100 | #60 | Exceptional $43,099 |
| Immigrants | Bulgaria | 99.9 /100 | #61 | Exceptional $43,085 |
| Afghans | 99.9 /100 | #62 | Exceptional $43,077 |
| Immigrants | Ukraine | 99.9 /100 | #63 | Exceptional $43,069 |
| Immigrants | Pakistan | 99.9 /100 | #64 | Exceptional $43,052 |
| Sierra Leoneans | 99.9 /100 | #65 | Exceptional $42,868 |
| Immigrants | Norway | 99.9 /100 | #66 | Exceptional $42,837 |
| Immigrants | Egypt | 99.9 /100 | #67 | Exceptional $42,837 |
| Immigrants | Austria | 99.8 /100 | #68 | Exceptional $42,824 |
| Immigrants | Spain | 99.8 /100 | #69 | Exceptional $42,815 |
| Immigrants | Ethiopia | 99.8 /100 | #70 | Exceptional $42,744 |
| Immigrants | Romania | 99.8 /100 | #71 | Exceptional $42,718 |