Bahamian vs German Russian Householder Income Under 25 years
COMPARE
Bahamian
German Russian
Householder Income Under 25 years
Householder Income Under 25 years Comparison
Bahamians
German Russians
$45,743
HOUSEHOLDER INCOME UNDER 25 YEARS
0.0/ 100
METRIC RATING
327th/ 347
METRIC RANK
$45,673
HOUSEHOLDER INCOME UNDER 25 YEARS
0.0/ 100
METRIC RATING
328th/ 347
METRIC RANK
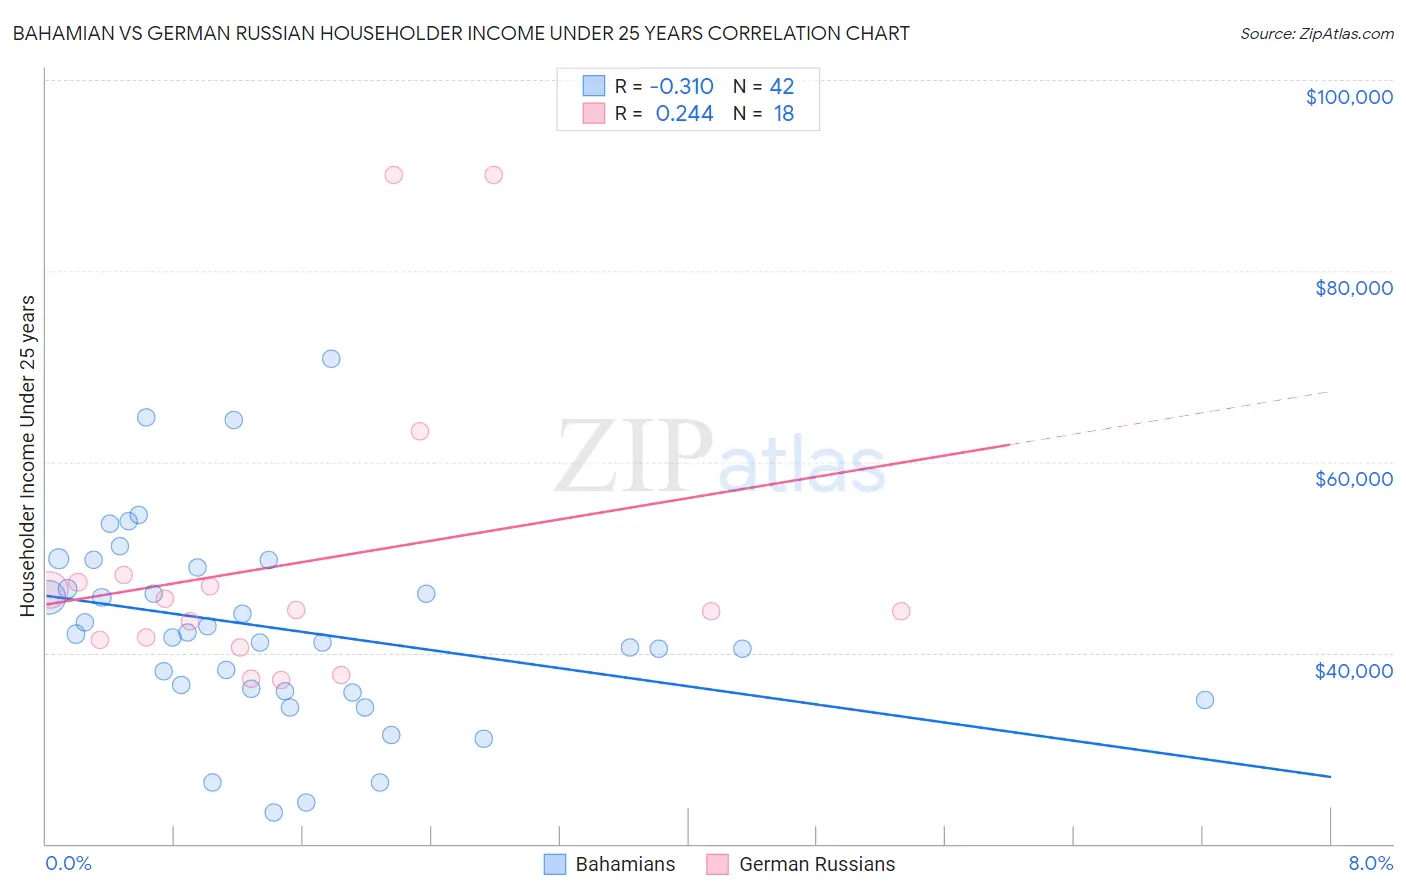
Bahamian vs German Russian Householder Income Under 25 years Correlation Chart
The statistical analysis conducted on geographies consisting of 104,021,755 people shows a mild negative correlation between the proportion of Bahamians and household income with householder under the age of 25 in the United States with a correlation coefficient (R) of -0.310 and weighted average of $45,743. Similarly, the statistical analysis conducted on geographies consisting of 91,630,953 people shows a weak positive correlation between the proportion of German Russians and household income with householder under the age of 25 in the United States with a correlation coefficient (R) of 0.244 and weighted average of $45,673, a difference of 0.15%.
Householder Income Under 25 years Correlation Summary
| Measurement | Bahamian | German Russian |
| Minimum | $23,250 | $37,121 |
| Maximum | $70,795 | $90,000 |
| Range | $47,545 | $52,879 |
| Mean | $42,583 | $49,457 |
| Median | $41,783 | $44,409 |
| Interquartile 25% (IQ1) | $36,008 | $41,330 |
| Interquartile 75% (IQ3) | $48,918 | $47,417 |
| Interquartile Range (IQR) | $12,910 | $6,088 |
| Standard Deviation (Sample) | $10,344 | $15,850 |
| Standard Deviation (Population) | $10,220 | $15,403 |
Demographics Similar to Bahamians and German Russians by Householder Income Under 25 years
In terms of householder income under 25 years, the demographic groups most similar to Bahamians are Osage ($45,764, a difference of 0.050%), Immigrants from Bahamas ($45,793, a difference of 0.11%), Dutch West Indian ($45,816, a difference of 0.16%), Seminole ($45,649, a difference of 0.21%), and Indonesian ($45,566, a difference of 0.39%). Similarly, the demographic groups most similar to German Russians are Seminole ($45,649, a difference of 0.050%), Osage ($45,764, a difference of 0.20%), Indonesian ($45,566, a difference of 0.23%), Immigrants from Bahamas ($45,793, a difference of 0.26%), and Dutch West Indian ($45,816, a difference of 0.31%).
| Demographics | Rating | Rank | Householder Income Under 25 years |
| Hopi | 0.0 /100 | #317 | Tragic $46,978 |
| Spanish Americans | 0.0 /100 | #318 | Tragic $46,913 |
| Africans | 0.0 /100 | #319 | Tragic $46,838 |
| Immigrants | Sudan | 0.0 /100 | #320 | Tragic $46,791 |
| Potawatomi | 0.0 /100 | #321 | Tragic $46,462 |
| Sioux | 0.0 /100 | #322 | Tragic $46,417 |
| Immigrants | Saudi Arabia | 0.0 /100 | #323 | Tragic $46,187 |
| Dutch West Indians | 0.0 /100 | #324 | Tragic $45,816 |
| Immigrants | Bahamas | 0.0 /100 | #325 | Tragic $45,793 |
| Osage | 0.0 /100 | #326 | Tragic $45,764 |
| Bahamians | 0.0 /100 | #327 | Tragic $45,743 |
| German Russians | 0.0 /100 | #328 | Tragic $45,673 |
| Seminole | 0.0 /100 | #329 | Tragic $45,649 |
| Indonesians | 0.0 /100 | #330 | Tragic $45,566 |
| Immigrants | Zaire | 0.0 /100 | #331 | Tragic $45,529 |
| Choctaw | 0.0 /100 | #332 | Tragic $45,450 |
| Creek | 0.0 /100 | #333 | Tragic $45,371 |
| Cajuns | 0.0 /100 | #334 | Tragic $45,338 |
| Cheyenne | 0.0 /100 | #335 | Tragic $45,275 |
| Tohono O'odham | 0.0 /100 | #336 | Tragic $45,248 |
| Pueblo | 0.0 /100 | #337 | Tragic $45,018 |