Austrian vs Immigrants from Egypt Per Capita Income
COMPARE
Austrian
Immigrants from Egypt
Per Capita Income
Per Capita Income Comparison
Austrians
Immigrants from Egypt
$48,116
PER CAPITA INCOME
99.3/ 100
METRIC RATING
85th/ 347
METRIC RANK
$47,361
PER CAPITA INCOME
98.5/ 100
METRIC RATING
95th/ 347
METRIC RANK
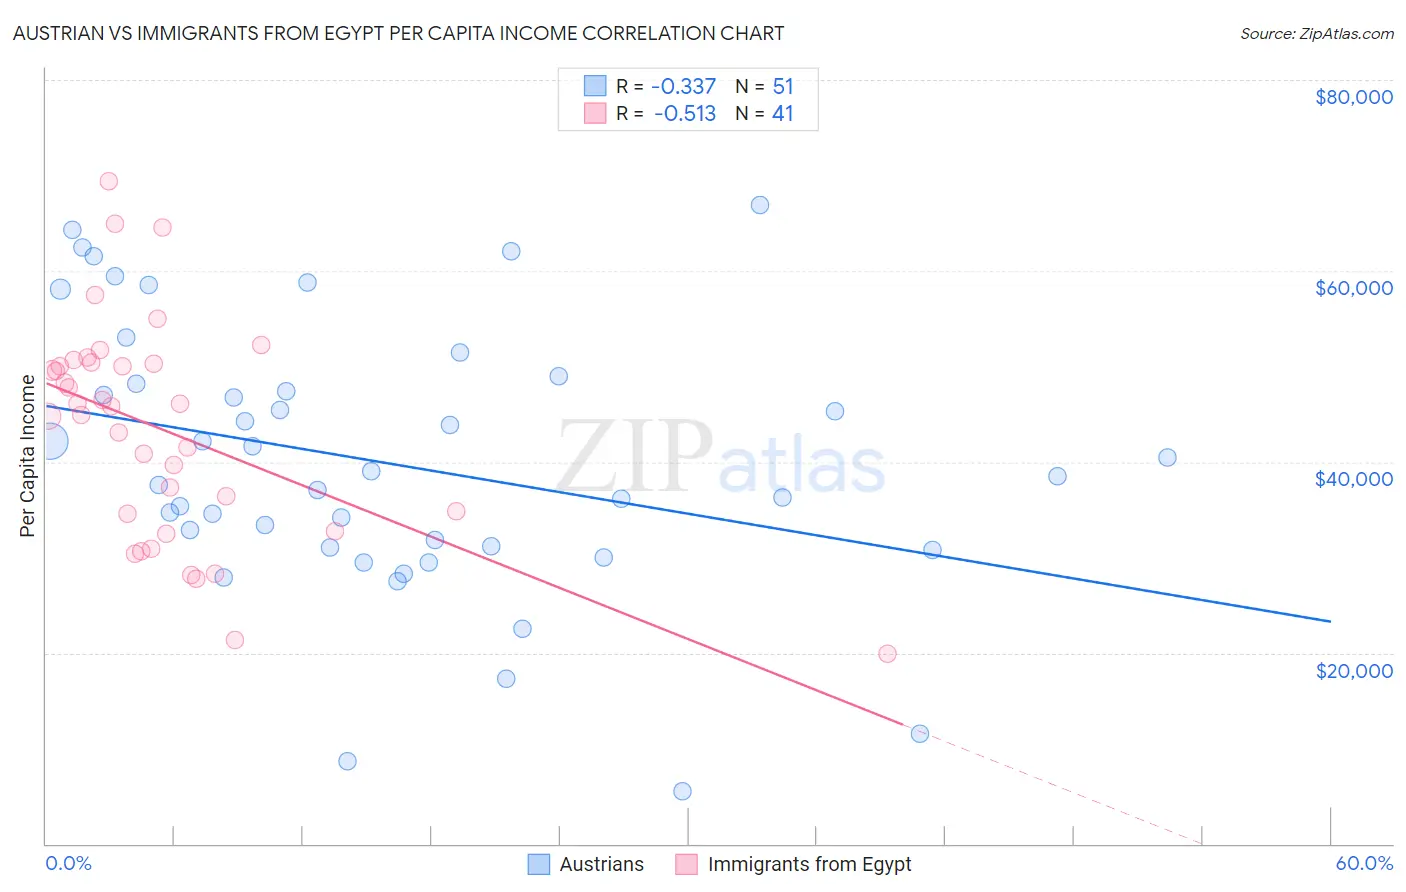
Austrian vs Immigrants from Egypt Per Capita Income Correlation Chart
The statistical analysis conducted on geographies consisting of 452,103,489 people shows a mild negative correlation between the proportion of Austrians and per capita income in the United States with a correlation coefficient (R) of -0.337 and weighted average of $48,116. Similarly, the statistical analysis conducted on geographies consisting of 245,495,655 people shows a substantial negative correlation between the proportion of Immigrants from Egypt and per capita income in the United States with a correlation coefficient (R) of -0.513 and weighted average of $47,361, a difference of 1.6%.
Per Capita Income Correlation Summary
| Measurement | Austrian | Immigrants from Egypt |
| Minimum | $5,500 | $19,900 |
| Maximum | $66,908 | $69,371 |
| Range | $61,408 | $49,471 |
| Mean | $39,852 | $43,359 |
| Median | $38,439 | $45,851 |
| Interquartile 25% (IQ1) | $31,067 | $33,676 |
| Interquartile 75% (IQ3) | $48,128 | $50,334 |
| Interquartile Range (IQR) | $17,061 | $16,658 |
| Standard Deviation (Sample) | $14,137 | $11,446 |
| Standard Deviation (Population) | $13,998 | $11,305 |
Demographics Similar to Austrians and Immigrants from Egypt by Per Capita Income
In terms of per capita income, the demographic groups most similar to Austrians are Immigrants from Ukraine ($48,134, a difference of 0.040%), Immigrants from Brazil ($48,164, a difference of 0.10%), Immigrants from Indonesia ($48,195, a difference of 0.16%), Immigrants from Southern Europe ($48,027, a difference of 0.18%), and Ukrainian ($48,014, a difference of 0.21%). Similarly, the demographic groups most similar to Immigrants from Egypt are Albanian ($47,379, a difference of 0.040%), Immigrants from Zimbabwe ($47,394, a difference of 0.070%), Alsatian ($47,284, a difference of 0.16%), Carpatho Rusyn ($47,248, a difference of 0.24%), and Immigrants from Moldova ($47,489, a difference of 0.27%).
| Demographics | Rating | Rank | Per Capita Income |
| Egyptians | 99.5 /100 | #80 | Exceptional $48,358 |
| Armenians | 99.4 /100 | #81 | Exceptional $48,287 |
| Immigrants | Indonesia | 99.4 /100 | #82 | Exceptional $48,195 |
| Immigrants | Brazil | 99.4 /100 | #83 | Exceptional $48,164 |
| Immigrants | Ukraine | 99.3 /100 | #84 | Exceptional $48,134 |
| Austrians | 99.3 /100 | #85 | Exceptional $48,116 |
| Immigrants | Southern Europe | 99.3 /100 | #86 | Exceptional $48,027 |
| Ukrainians | 99.3 /100 | #87 | Exceptional $48,014 |
| Croatians | 99.0 /100 | #88 | Exceptional $47,742 |
| Northern Europeans | 98.9 /100 | #89 | Exceptional $47,698 |
| Italians | 98.8 /100 | #90 | Exceptional $47,574 |
| Macedonians | 98.8 /100 | #91 | Exceptional $47,573 |
| Immigrants | Moldova | 98.7 /100 | #92 | Exceptional $47,489 |
| Immigrants | Zimbabwe | 98.5 /100 | #93 | Exceptional $47,394 |
| Albanians | 98.5 /100 | #94 | Exceptional $47,379 |
| Immigrants | Egypt | 98.5 /100 | #95 | Exceptional $47,361 |
| Alsatians | 98.3 /100 | #96 | Exceptional $47,284 |
| Carpatho Rusyns | 98.2 /100 | #97 | Exceptional $47,248 |
| Immigrants | Pakistan | 97.9 /100 | #98 | Exceptional $47,084 |
| Laotians | 97.8 /100 | #99 | Exceptional $47,041 |
| Immigrants | Lebanon | 97.5 /100 | #100 | Exceptional $46,938 |