Asian vs Icelander Householder Income Ages 45 - 64 years
COMPARE
Asian
Icelander
Householder Income Ages 45 - 64 years
Householder Income Ages 45 - 64 years Comparison
Asians
Icelanders
$118,426
HOUSEHOLDER INCOME AGES 45 - 64 YEARS
100.0/ 100
METRIC RATING
25th/ 347
METRIC RANK
$102,261
HOUSEHOLDER INCOME AGES 45 - 64 YEARS
72.5/ 100
METRIC RATING
160th/ 347
METRIC RANK
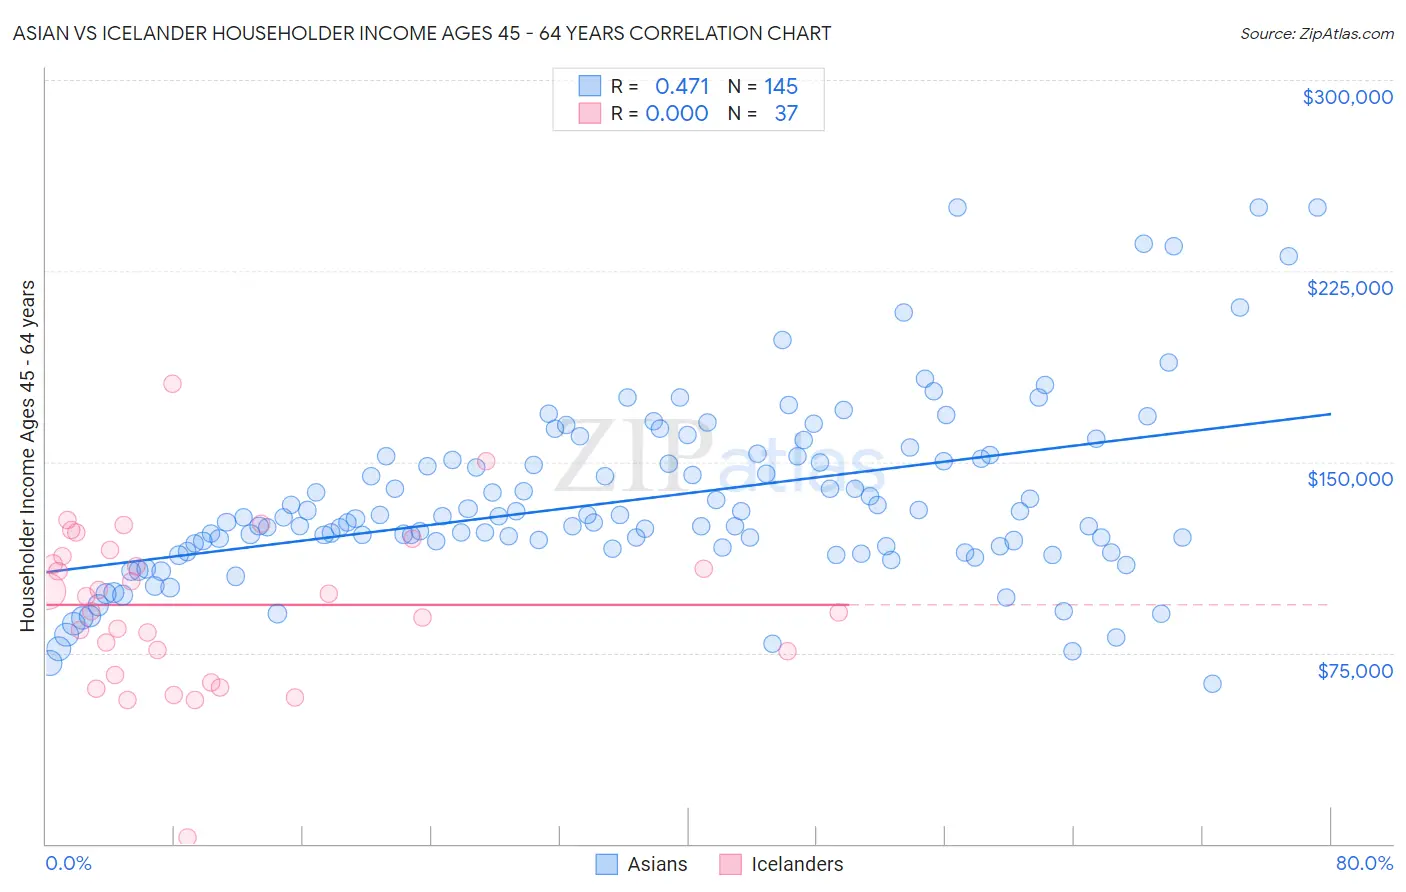
Asian vs Icelander Householder Income Ages 45 - 64 years Correlation Chart
The statistical analysis conducted on geographies consisting of 548,262,581 people shows a moderate positive correlation between the proportion of Asians and household income with householder between the ages 45 and 64 in the United States with a correlation coefficient (R) of 0.471 and weighted average of $118,426. Similarly, the statistical analysis conducted on geographies consisting of 159,562,808 people shows no correlation between the proportion of Icelanders and household income with householder between the ages 45 and 64 in the United States with a correlation coefficient (R) of 0.000 and weighted average of $102,261, a difference of 15.8%.
Householder Income Ages 45 - 64 years Correlation Summary
| Measurement | Asian | Icelander |
| Minimum | $62,982 | $2,499 |
| Maximum | $250,001 | $180,868 |
| Range | $187,019 | $178,369 |
| Mean | $135,000 | $93,816 |
| Median | $127,763 | $97,265 |
| Interquartile 25% (IQ1) | $116,265 | $70,912 |
| Interquartile 75% (IQ3) | $151,736 | $114,136 |
| Interquartile Range (IQR) | $35,471 | $43,224 |
| Standard Deviation (Sample) | $35,213 | $32,005 |
| Standard Deviation (Population) | $35,092 | $31,569 |
Similar Demographics by Householder Income Ages 45 - 64 years
Demographics Similar to Asians by Householder Income Ages 45 - 64 years
In terms of householder income ages 45 - 64 years, the demographic groups most similar to Asians are Immigrants from Japan ($118,498, a difference of 0.060%), Immigrants from Sweden ($118,318, a difference of 0.090%), Bolivian ($118,871, a difference of 0.38%), Immigrants from Northern Europe ($117,930, a difference of 0.42%), and Immigrants from Belgium ($118,932, a difference of 0.43%).
| Demographics | Rating | Rank | Householder Income Ages 45 - 64 years |
| Immigrants | Korea | 100.0 /100 | #18 | Exceptional $121,243 |
| Eastern Europeans | 100.0 /100 | #19 | Exceptional $120,684 |
| Immigrants | Australia | 100.0 /100 | #20 | Exceptional $119,308 |
| Immigrants | Sri Lanka | 100.0 /100 | #21 | Exceptional $119,094 |
| Immigrants | Belgium | 100.0 /100 | #22 | Exceptional $118,932 |
| Bolivians | 100.0 /100 | #23 | Exceptional $118,871 |
| Immigrants | Japan | 100.0 /100 | #24 | Exceptional $118,498 |
| Asians | 100.0 /100 | #25 | Exceptional $118,426 |
| Immigrants | Sweden | 100.0 /100 | #26 | Exceptional $118,318 |
| Immigrants | Northern Europe | 100.0 /100 | #27 | Exceptional $117,930 |
| Turks | 100.0 /100 | #28 | Exceptional $117,814 |
| Bhutanese | 100.0 /100 | #29 | Exceptional $117,750 |
| Immigrants | Bolivia | 100.0 /100 | #30 | Exceptional $117,731 |
| Immigrants | Asia | 100.0 /100 | #31 | Exceptional $116,566 |
| Russians | 100.0 /100 | #32 | Exceptional $116,328 |
Demographics Similar to Icelanders by Householder Income Ages 45 - 64 years
In terms of householder income ages 45 - 64 years, the demographic groups most similar to Icelanders are Immigrants from Nepal ($102,190, a difference of 0.070%), Scottish ($102,123, a difference of 0.14%), Sierra Leonean ($102,427, a difference of 0.16%), English ($102,021, a difference of 0.24%), and Immigrants from Morocco ($102,015, a difference of 0.24%).
| Demographics | Rating | Rank | Householder Income Ages 45 - 64 years |
| Scandinavians | 79.0 /100 | #153 | Good $102,969 |
| Slovenes | 78.3 /100 | #154 | Good $102,885 |
| Costa Ricans | 77.4 /100 | #155 | Good $102,779 |
| Carpatho Rusyns | 77.4 /100 | #156 | Good $102,777 |
| Immigrants | Ethiopia | 77.3 /100 | #157 | Good $102,763 |
| Slavs | 76.1 /100 | #158 | Good $102,629 |
| Sierra Leoneans | 74.2 /100 | #159 | Good $102,427 |
| Icelanders | 72.5 /100 | #160 | Good $102,261 |
| Immigrants | Nepal | 71.8 /100 | #161 | Good $102,190 |
| Scottish | 71.1 /100 | #162 | Good $102,123 |
| English | 70.1 /100 | #163 | Good $102,021 |
| Immigrants | Morocco | 70.0 /100 | #164 | Good $102,015 |
| Immigrants | Albania | 69.4 /100 | #165 | Good $101,957 |
| Samoans | 65.3 /100 | #166 | Good $101,580 |
| Czechoslovakians | 63.0 /100 | #167 | Good $101,387 |