Asian vs Alaskan Athabascan Median Household Income
COMPARE
Asian
Alaskan Athabascan
Median Household Income
Median Household Income Comparison
Asians
Alaskan Athabascans
$101,681
MEDIAN HOUSEHOLD INCOME
100.0/ 100
METRIC RATING
22nd/ 347
METRIC RANK
$76,383
MEDIAN HOUSEHOLD INCOME
0.4/ 100
METRIC RATING
263rd/ 347
METRIC RANK
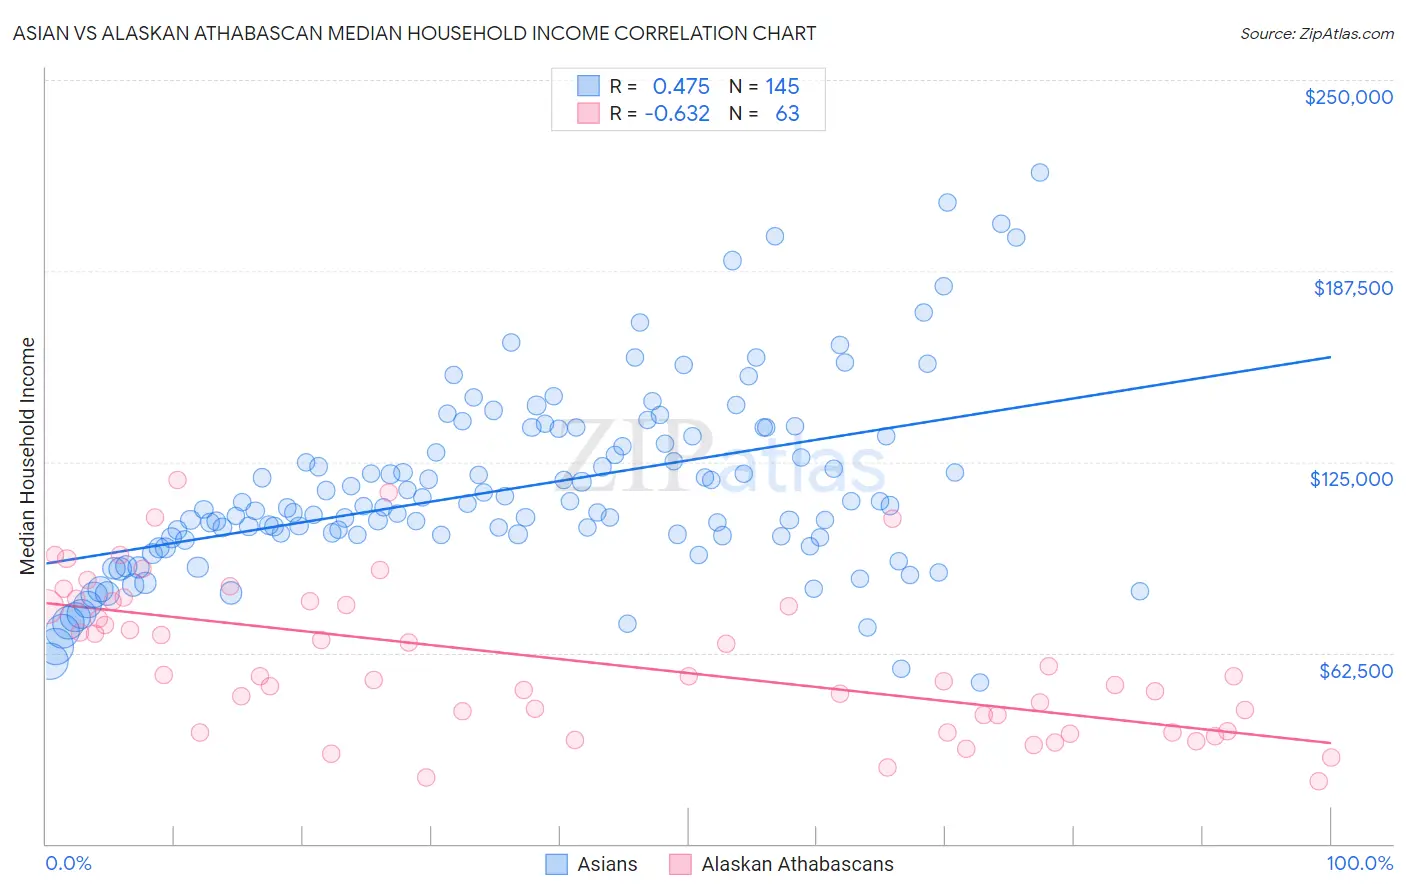
Asian vs Alaskan Athabascan Median Household Income Correlation Chart
The statistical analysis conducted on geographies consisting of 549,980,753 people shows a moderate positive correlation between the proportion of Asians and median household income in the United States with a correlation coefficient (R) of 0.475 and weighted average of $101,681. Similarly, the statistical analysis conducted on geographies consisting of 45,812,420 people shows a significant negative correlation between the proportion of Alaskan Athabascans and median household income in the United States with a correlation coefficient (R) of -0.632 and weighted average of $76,383, a difference of 33.1%.
Median Household Income Correlation Summary
| Measurement | Asian | Alaskan Athabascan |
| Minimum | $52,658 | $20,417 |
| Maximum | $219,913 | $118,934 |
| Range | $167,255 | $98,517 |
| Mean | $116,419 | $60,171 |
| Median | $110,126 | $55,000 |
| Interquartile 25% (IQ1) | $100,433 | $36,964 |
| Interquartile 75% (IQ3) | $133,482 | $79,438 |
| Interquartile Range (IQR) | $33,049 | $42,474 |
| Standard Deviation (Sample) | $30,496 | $24,397 |
| Standard Deviation (Population) | $30,391 | $24,203 |
Similar Demographics by Median Household Income
Demographics Similar to Asians by Median Household Income
In terms of median household income, the demographic groups most similar to Asians are Eastern European ($101,781, a difference of 0.10%), Immigrants from Bolivia ($101,394, a difference of 0.28%), Bolivian ($102,195, a difference of 0.50%), Immigrants from Australia ($102,562, a difference of 0.87%), and Immigrants from Japan ($100,711, a difference of 0.96%).
| Demographics | Rating | Rank | Median Household Income |
| Immigrants | Israel | 100.0 /100 | #15 | Exceptional $104,090 |
| Burmese | 100.0 /100 | #16 | Exceptional $103,145 |
| Immigrants | Korea | 100.0 /100 | #17 | Exceptional $102,962 |
| Cypriots | 100.0 /100 | #18 | Exceptional $102,843 |
| Immigrants | Australia | 100.0 /100 | #19 | Exceptional $102,562 |
| Bolivians | 100.0 /100 | #20 | Exceptional $102,195 |
| Eastern Europeans | 100.0 /100 | #21 | Exceptional $101,781 |
| Asians | 100.0 /100 | #22 | Exceptional $101,681 |
| Immigrants | Bolivia | 100.0 /100 | #23 | Exceptional $101,394 |
| Immigrants | Japan | 100.0 /100 | #24 | Exceptional $100,711 |
| Immigrants | Sweden | 100.0 /100 | #25 | Exceptional $100,699 |
| Immigrants | Belgium | 100.0 /100 | #26 | Exceptional $100,306 |
| Bhutanese | 100.0 /100 | #27 | Exceptional $100,151 |
| Immigrants | Sri Lanka | 100.0 /100 | #28 | Exceptional $99,943 |
| Immigrants | Asia | 100.0 /100 | #29 | Exceptional $99,933 |
Demographics Similar to Alaskan Athabascans by Median Household Income
In terms of median household income, the demographic groups most similar to Alaskan Athabascans are French American Indian ($76,387, a difference of 0.010%), Immigrants from Grenada ($76,517, a difference of 0.18%), Jamaican ($76,583, a difference of 0.26%), Spanish American Indian ($76,670, a difference of 0.38%), and Immigrants from Nicaragua ($76,784, a difference of 0.52%).
| Demographics | Rating | Rank | Median Household Income |
| Belizeans | 0.6 /100 | #256 | Tragic $77,028 |
| Immigrants | Senegal | 0.5 /100 | #257 | Tragic $76,915 |
| Immigrants | Nicaragua | 0.5 /100 | #258 | Tragic $76,784 |
| Spanish American Indians | 0.4 /100 | #259 | Tragic $76,670 |
| Jamaicans | 0.4 /100 | #260 | Tragic $76,583 |
| Immigrants | Grenada | 0.4 /100 | #261 | Tragic $76,517 |
| French American Indians | 0.4 /100 | #262 | Tragic $76,387 |
| Alaskan Athabascans | 0.4 /100 | #263 | Tragic $76,383 |
| Guatemalans | 0.3 /100 | #264 | Tragic $75,961 |
| Immigrants | Belize | 0.3 /100 | #265 | Tragic $75,938 |
| Americans | 0.3 /100 | #266 | Tragic $75,932 |
| German Russians | 0.3 /100 | #267 | Tragic $75,856 |
| Immigrants | Jamaica | 0.3 /100 | #268 | Tragic $75,851 |
| Cape Verdeans | 0.3 /100 | #269 | Tragic $75,848 |
| Hmong | 0.3 /100 | #270 | Tragic $75,839 |