Argentinean vs Arab Median Household Income
COMPARE
Argentinean
Arab
Median Household Income
Median Household Income Comparison
Argentineans
Arabs
$93,960
MEDIAN HOUSEHOLD INCOME
99.7/ 100
METRIC RATING
69th/ 347
METRIC RANK
$88,398
MEDIAN HOUSEHOLD INCOME
89.2/ 100
METRIC RATING
138th/ 347
METRIC RANK
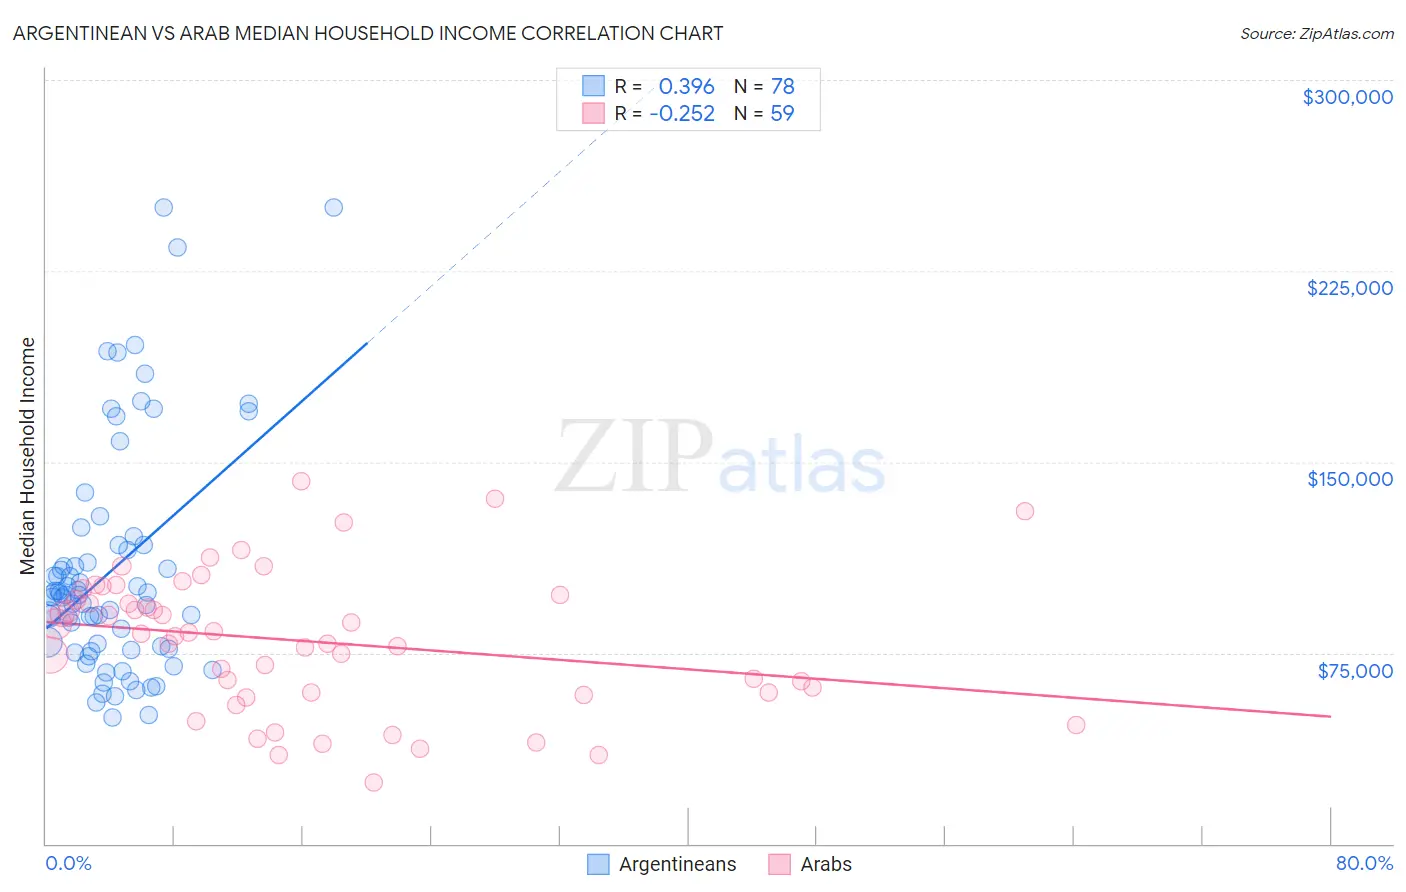
Argentinean vs Arab Median Household Income Correlation Chart
The statistical analysis conducted on geographies consisting of 296,944,042 people shows a mild positive correlation between the proportion of Argentineans and median household income in the United States with a correlation coefficient (R) of 0.396 and weighted average of $93,960. Similarly, the statistical analysis conducted on geographies consisting of 486,242,528 people shows a weak negative correlation between the proportion of Arabs and median household income in the United States with a correlation coefficient (R) of -0.252 and weighted average of $88,398, a difference of 6.3%.
Median Household Income Correlation Summary
| Measurement | Argentinean | Arab |
| Minimum | $49,375 | $23,929 |
| Maximum | $250,001 | $142,260 |
| Range | $200,626 | $118,331 |
| Mean | $107,782 | $79,535 |
| Median | $97,608 | $82,260 |
| Interquartile 25% (IQ1) | $76,750 | $59,535 |
| Interquartile 75% (IQ3) | $117,422 | $97,787 |
| Interquartile Range (IQR) | $40,672 | $38,252 |
| Standard Deviation (Sample) | $45,385 | $27,234 |
| Standard Deviation (Population) | $45,093 | $27,002 |
Similar Demographics by Median Household Income
Demographics Similar to Argentineans by Median Household Income
In terms of median household income, the demographic groups most similar to Argentineans are Mongolian ($93,971, a difference of 0.010%), Immigrants from Fiji ($93,933, a difference of 0.030%), Immigrants from Philippines ($93,899, a difference of 0.070%), Lithuanian ($93,852, a difference of 0.11%), and Immigrants from Scotland ($94,091, a difference of 0.14%).
| Demographics | Rating | Rank | Median Household Income |
| Immigrants | Norway | 99.8 /100 | #62 | Exceptional $94,846 |
| Greeks | 99.8 /100 | #63 | Exceptional $94,735 |
| Immigrants | Netherlands | 99.7 /100 | #64 | Exceptional $94,411 |
| Immigrants | Belarus | 99.7 /100 | #65 | Exceptional $94,399 |
| Immigrants | Romania | 99.7 /100 | #66 | Exceptional $94,222 |
| Immigrants | Scotland | 99.7 /100 | #67 | Exceptional $94,091 |
| Mongolians | 99.7 /100 | #68 | Exceptional $93,971 |
| Argentineans | 99.7 /100 | #69 | Exceptional $93,960 |
| Immigrants | Fiji | 99.7 /100 | #70 | Exceptional $93,933 |
| Immigrants | Philippines | 99.6 /100 | #71 | Exceptional $93,899 |
| Lithuanians | 99.6 /100 | #72 | Exceptional $93,852 |
| Immigrants | Egypt | 99.6 /100 | #73 | Exceptional $93,700 |
| Immigrants | Latvia | 99.6 /100 | #74 | Exceptional $93,602 |
| Immigrants | Italy | 99.5 /100 | #75 | Exceptional $93,465 |
| South Africans | 99.5 /100 | #76 | Exceptional $93,379 |
Demographics Similar to Arabs by Median Household Income
In terms of median household income, the demographic groups most similar to Arabs are Immigrants from Chile ($88,388, a difference of 0.010%), Sierra Leonean ($88,463, a difference of 0.070%), Polish ($88,472, a difference of 0.080%), Immigrants from Sierra Leone ($88,498, a difference of 0.11%), and Swedish ($88,524, a difference of 0.14%).
| Demographics | Rating | Rank | Median Household Income |
| Immigrants | Syria | 91.4 /100 | #131 | Exceptional $88,792 |
| Europeans | 91.2 /100 | #132 | Exceptional $88,751 |
| Immigrants | Ethiopia | 90.9 /100 | #133 | Exceptional $88,687 |
| Swedes | 90.0 /100 | #134 | Exceptional $88,524 |
| Immigrants | Sierra Leone | 89.9 /100 | #135 | Excellent $88,498 |
| Poles | 89.7 /100 | #136 | Excellent $88,472 |
| Sierra Leoneans | 89.6 /100 | #137 | Excellent $88,463 |
| Arabs | 89.2 /100 | #138 | Excellent $88,398 |
| Immigrants | Chile | 89.2 /100 | #139 | Excellent $88,388 |
| Lebanese | 87.2 /100 | #140 | Excellent $88,091 |
| Immigrants | Morocco | 86.0 /100 | #141 | Excellent $87,930 |
| Canadians | 84.7 /100 | #142 | Excellent $87,769 |
| Danes | 83.9 /100 | #143 | Excellent $87,676 |
| Serbians | 83.0 /100 | #144 | Excellent $87,572 |
| Ugandans | 82.9 /100 | #145 | Excellent $87,557 |