Arapaho vs Fijian Median Male Earnings
COMPARE
Arapaho
Fijian
Median Male Earnings
Median Male Earnings Comparison
Arapaho
Fijians
$41,758
MEDIAN MALE EARNINGS
0.0/ 100
METRIC RATING
342nd/ 347
METRIC RANK
$45,607
MEDIAN MALE EARNINGS
0.0/ 100
METRIC RATING
321st/ 347
METRIC RANK
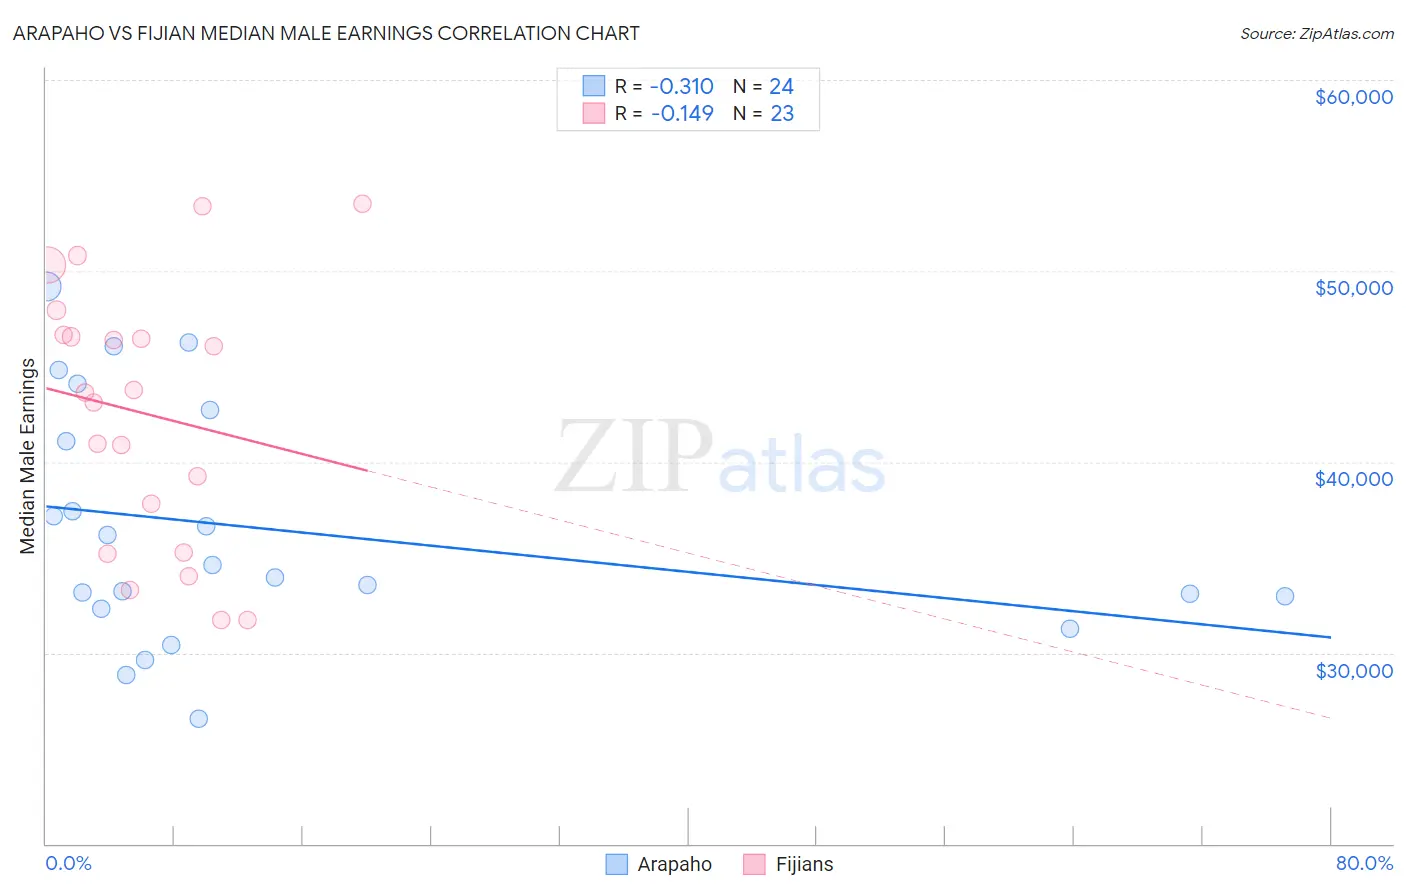
Arapaho vs Fijian Median Male Earnings Correlation Chart
The statistical analysis conducted on geographies consisting of 29,771,934 people shows a mild negative correlation between the proportion of Arapaho and median male earnings in the United States with a correlation coefficient (R) of -0.310 and weighted average of $41,758. Similarly, the statistical analysis conducted on geographies consisting of 55,945,280 people shows a poor negative correlation between the proportion of Fijians and median male earnings in the United States with a correlation coefficient (R) of -0.149 and weighted average of $45,607, a difference of 9.2%.
Median Male Earnings Correlation Summary
| Measurement | Arapaho | Fijian |
| Minimum | $26,527 | $31,736 |
| Maximum | $49,176 | $53,542 |
| Range | $22,649 | $21,806 |
| Mean | $36,456 | $42,546 |
| Median | $34,270 | $43,625 |
| Interquartile 25% (IQ1) | $32,621 | $35,286 |
| Interquartile 75% (IQ3) | $41,897 | $46,656 |
| Interquartile Range (IQR) | $9,276 | $11,370 |
| Standard Deviation (Sample) | $6,211 | $6,788 |
| Standard Deviation (Population) | $6,080 | $6,639 |
Similar Demographics by Median Male Earnings
Demographics Similar to Arapaho by Median Male Earnings
In terms of median male earnings, the demographic groups most similar to Arapaho are Lumbee ($41,715, a difference of 0.10%), Hopi ($42,060, a difference of 0.72%), Navajo ($42,098, a difference of 0.81%), Pueblo ($41,314, a difference of 1.1%), and Pima ($42,357, a difference of 1.4%).
| Demographics | Rating | Rank | Median Male Earnings |
| Immigrants | Congo | 0.0 /100 | #333 | Tragic $44,204 |
| Immigrants | Yemen | 0.0 /100 | #334 | Tragic $44,083 |
| Spanish American Indians | 0.0 /100 | #335 | Tragic $44,010 |
| Immigrants | Cuba | 0.0 /100 | #336 | Tragic $43,461 |
| Menominee | 0.0 /100 | #337 | Tragic $42,581 |
| Crow | 0.0 /100 | #338 | Tragic $42,434 |
| Pima | 0.0 /100 | #339 | Tragic $42,357 |
| Navajo | 0.0 /100 | #340 | Tragic $42,098 |
| Hopi | 0.0 /100 | #341 | Tragic $42,060 |
| Arapaho | 0.0 /100 | #342 | Tragic $41,758 |
| Lumbee | 0.0 /100 | #343 | Tragic $41,715 |
| Pueblo | 0.0 /100 | #344 | Tragic $41,314 |
| Puerto Ricans | 0.0 /100 | #345 | Tragic $40,071 |
| Tohono O'odham | 0.0 /100 | #346 | Tragic $39,543 |
| Yup'ik | 0.0 /100 | #347 | Tragic $39,504 |
Demographics Similar to Fijians by Median Male Earnings
In terms of median male earnings, the demographic groups most similar to Fijians are Sioux ($45,566, a difference of 0.090%), Immigrants from Central America ($45,538, a difference of 0.15%), Black/African American ($45,523, a difference of 0.18%), Yuman ($45,446, a difference of 0.35%), and Immigrants from Honduras ($45,787, a difference of 0.39%).
| Demographics | Rating | Rank | Median Male Earnings |
| Chippewa | 0.0 /100 | #314 | Tragic $46,368 |
| Immigrants | Guatemala | 0.0 /100 | #315 | Tragic $46,244 |
| Immigrants | Caribbean | 0.0 /100 | #316 | Tragic $46,193 |
| Mexicans | 0.0 /100 | #317 | Tragic $46,147 |
| Cheyenne | 0.0 /100 | #318 | Tragic $46,062 |
| Haitians | 0.0 /100 | #319 | Tragic $45,903 |
| Immigrants | Honduras | 0.0 /100 | #320 | Tragic $45,787 |
| Fijians | 0.0 /100 | #321 | Tragic $45,607 |
| Sioux | 0.0 /100 | #322 | Tragic $45,566 |
| Immigrants | Central America | 0.0 /100 | #323 | Tragic $45,538 |
| Blacks/African Americans | 0.0 /100 | #324 | Tragic $45,523 |
| Yuman | 0.0 /100 | #325 | Tragic $45,446 |
| Immigrants | Haiti | 0.0 /100 | #326 | Tragic $45,266 |
| Immigrants | Bahamas | 0.0 /100 | #327 | Tragic $45,176 |
| Kiowa | 0.0 /100 | #328 | Tragic $45,094 |